Volumes / Journal / 24 - 2013 / Alberti G.
Click on any image to open slideshow
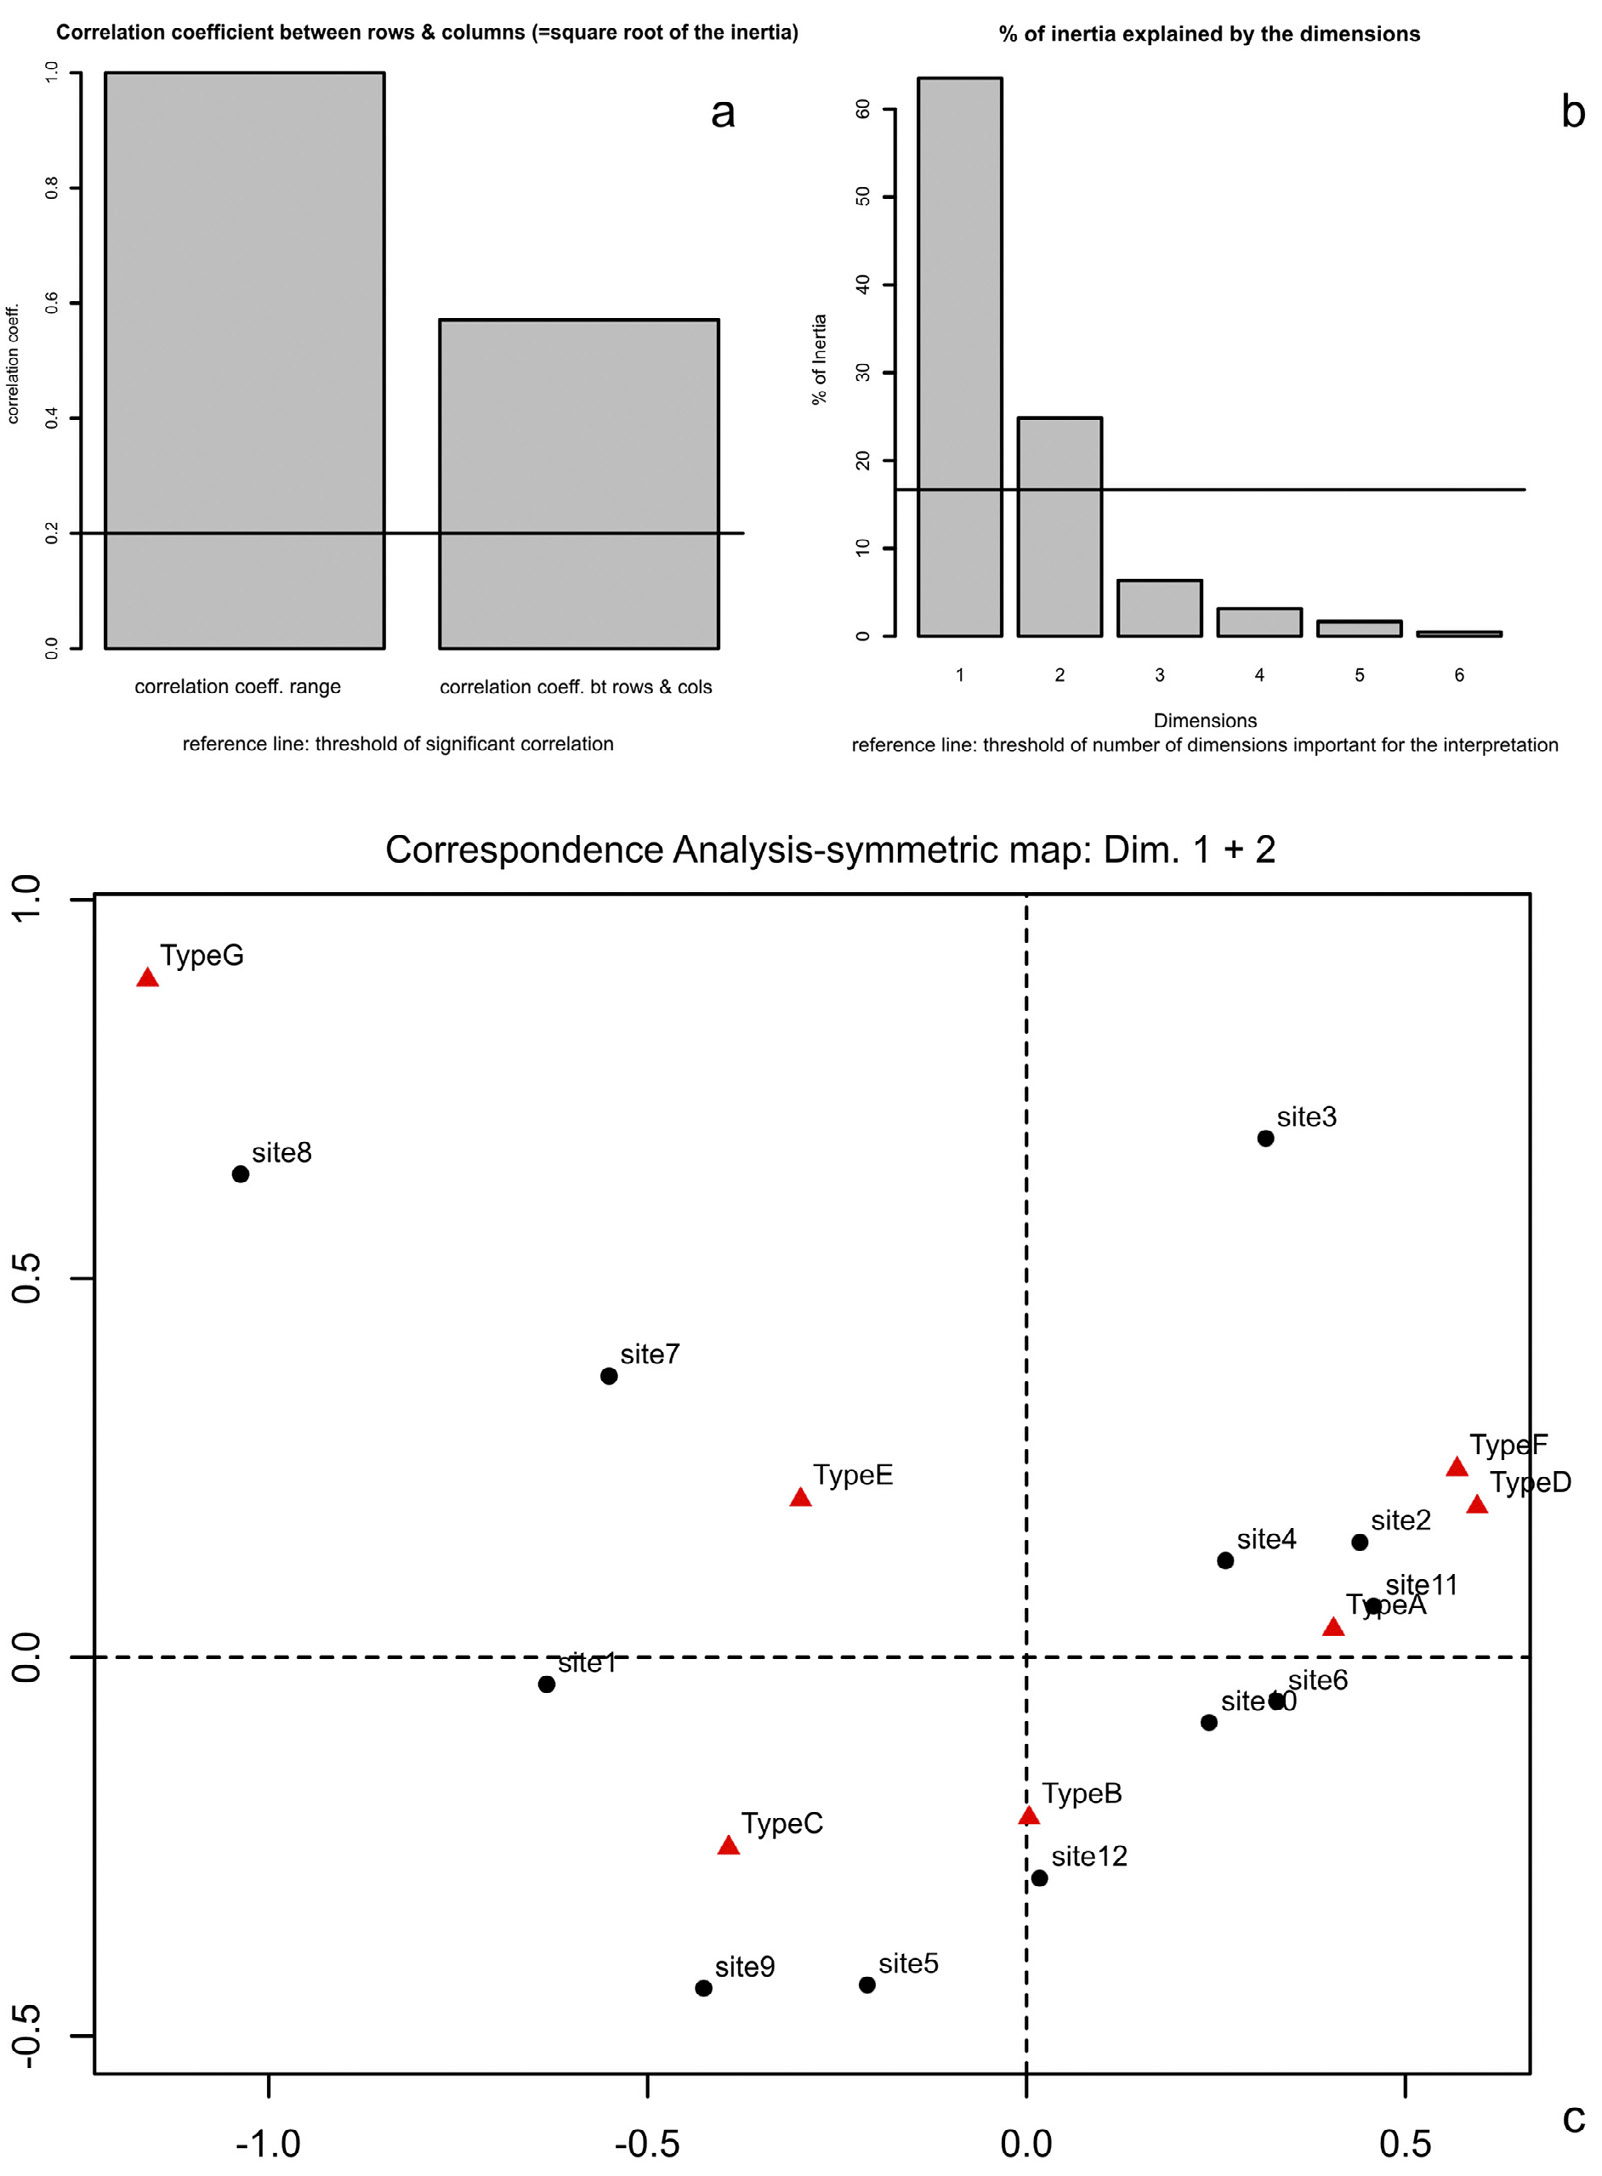
Fig. 1 – CA on data of Tab. 1. Charts provided by the R script. a) Bar chart sho...
Fig. 2 – CA on data of Tab. 1. Charts provided by the R script: interpretation o...
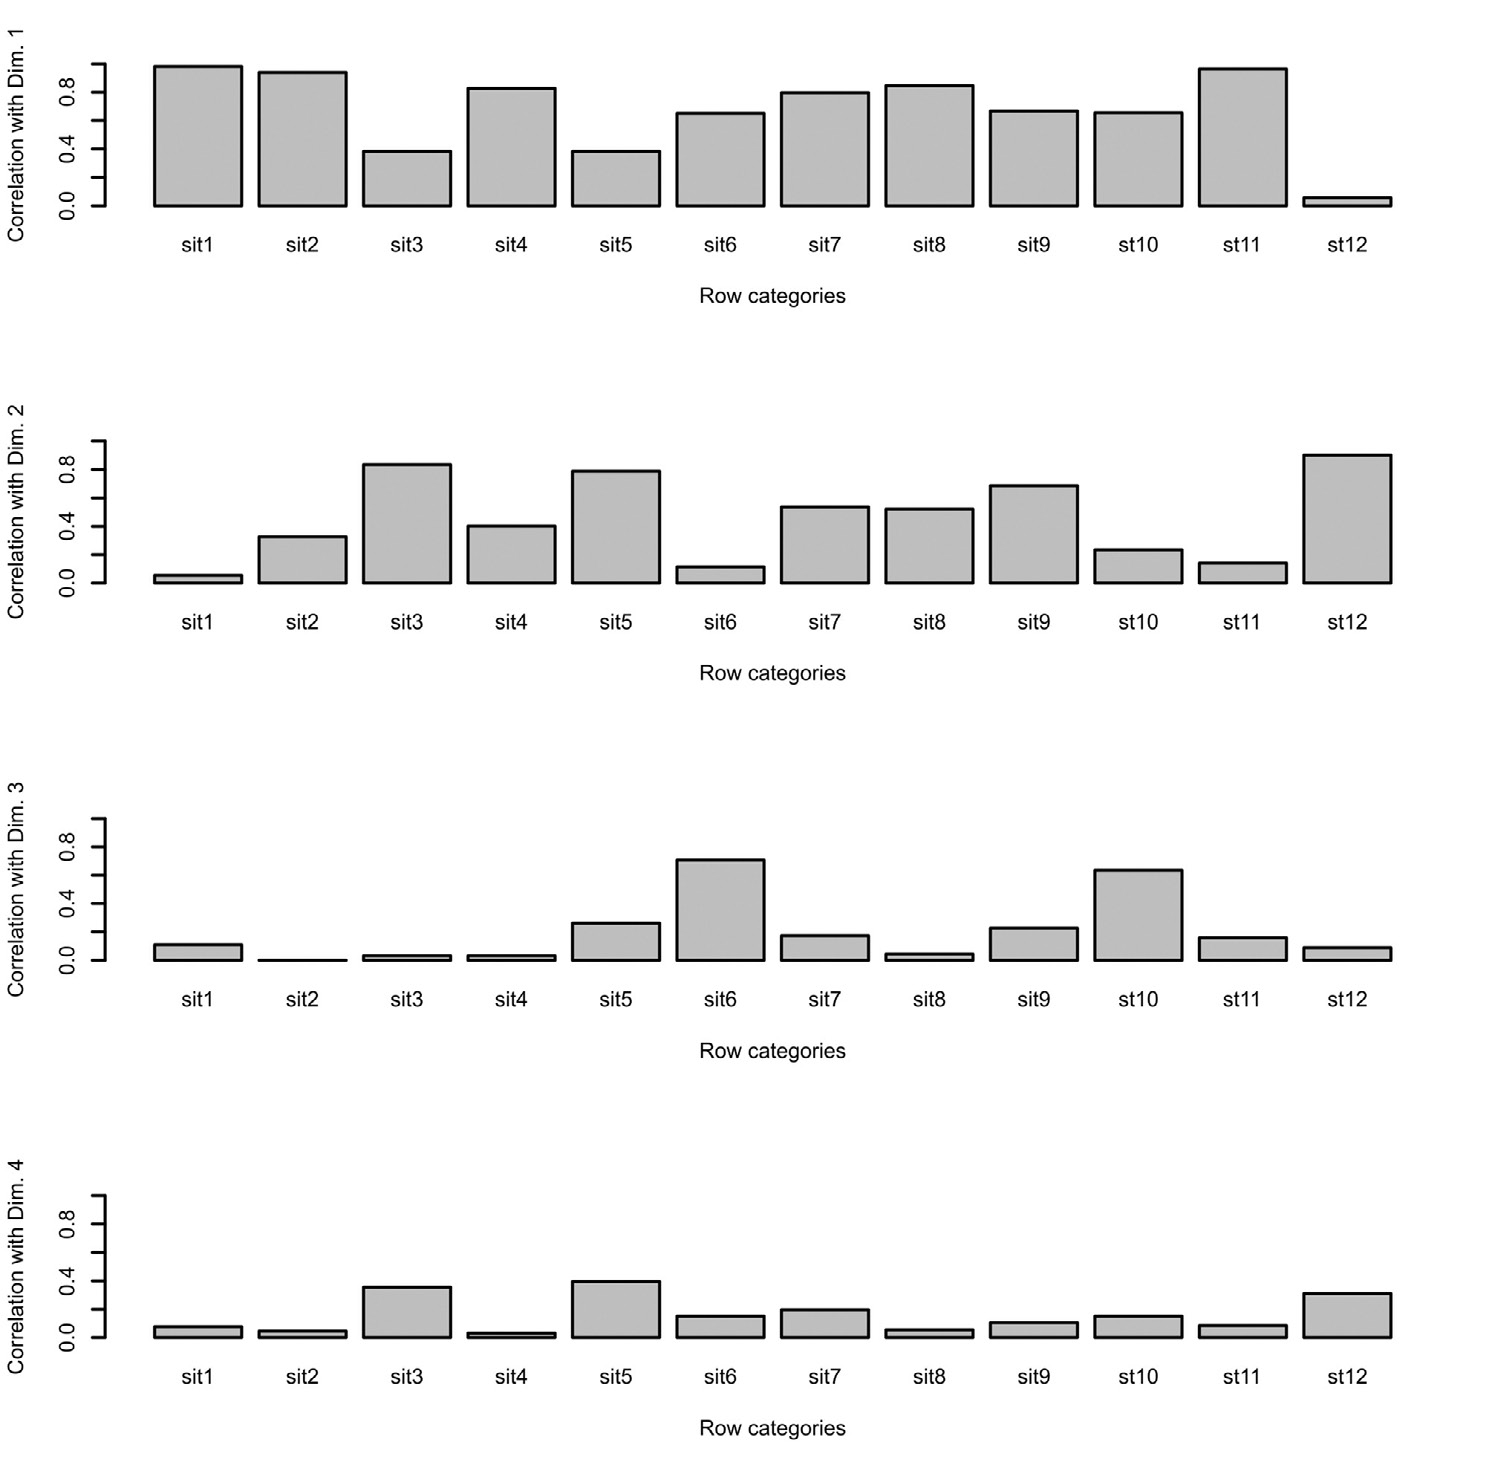
Fig. 3 – CA on data of Tab. 1. Charts provided by the R script. Bar chart showin...
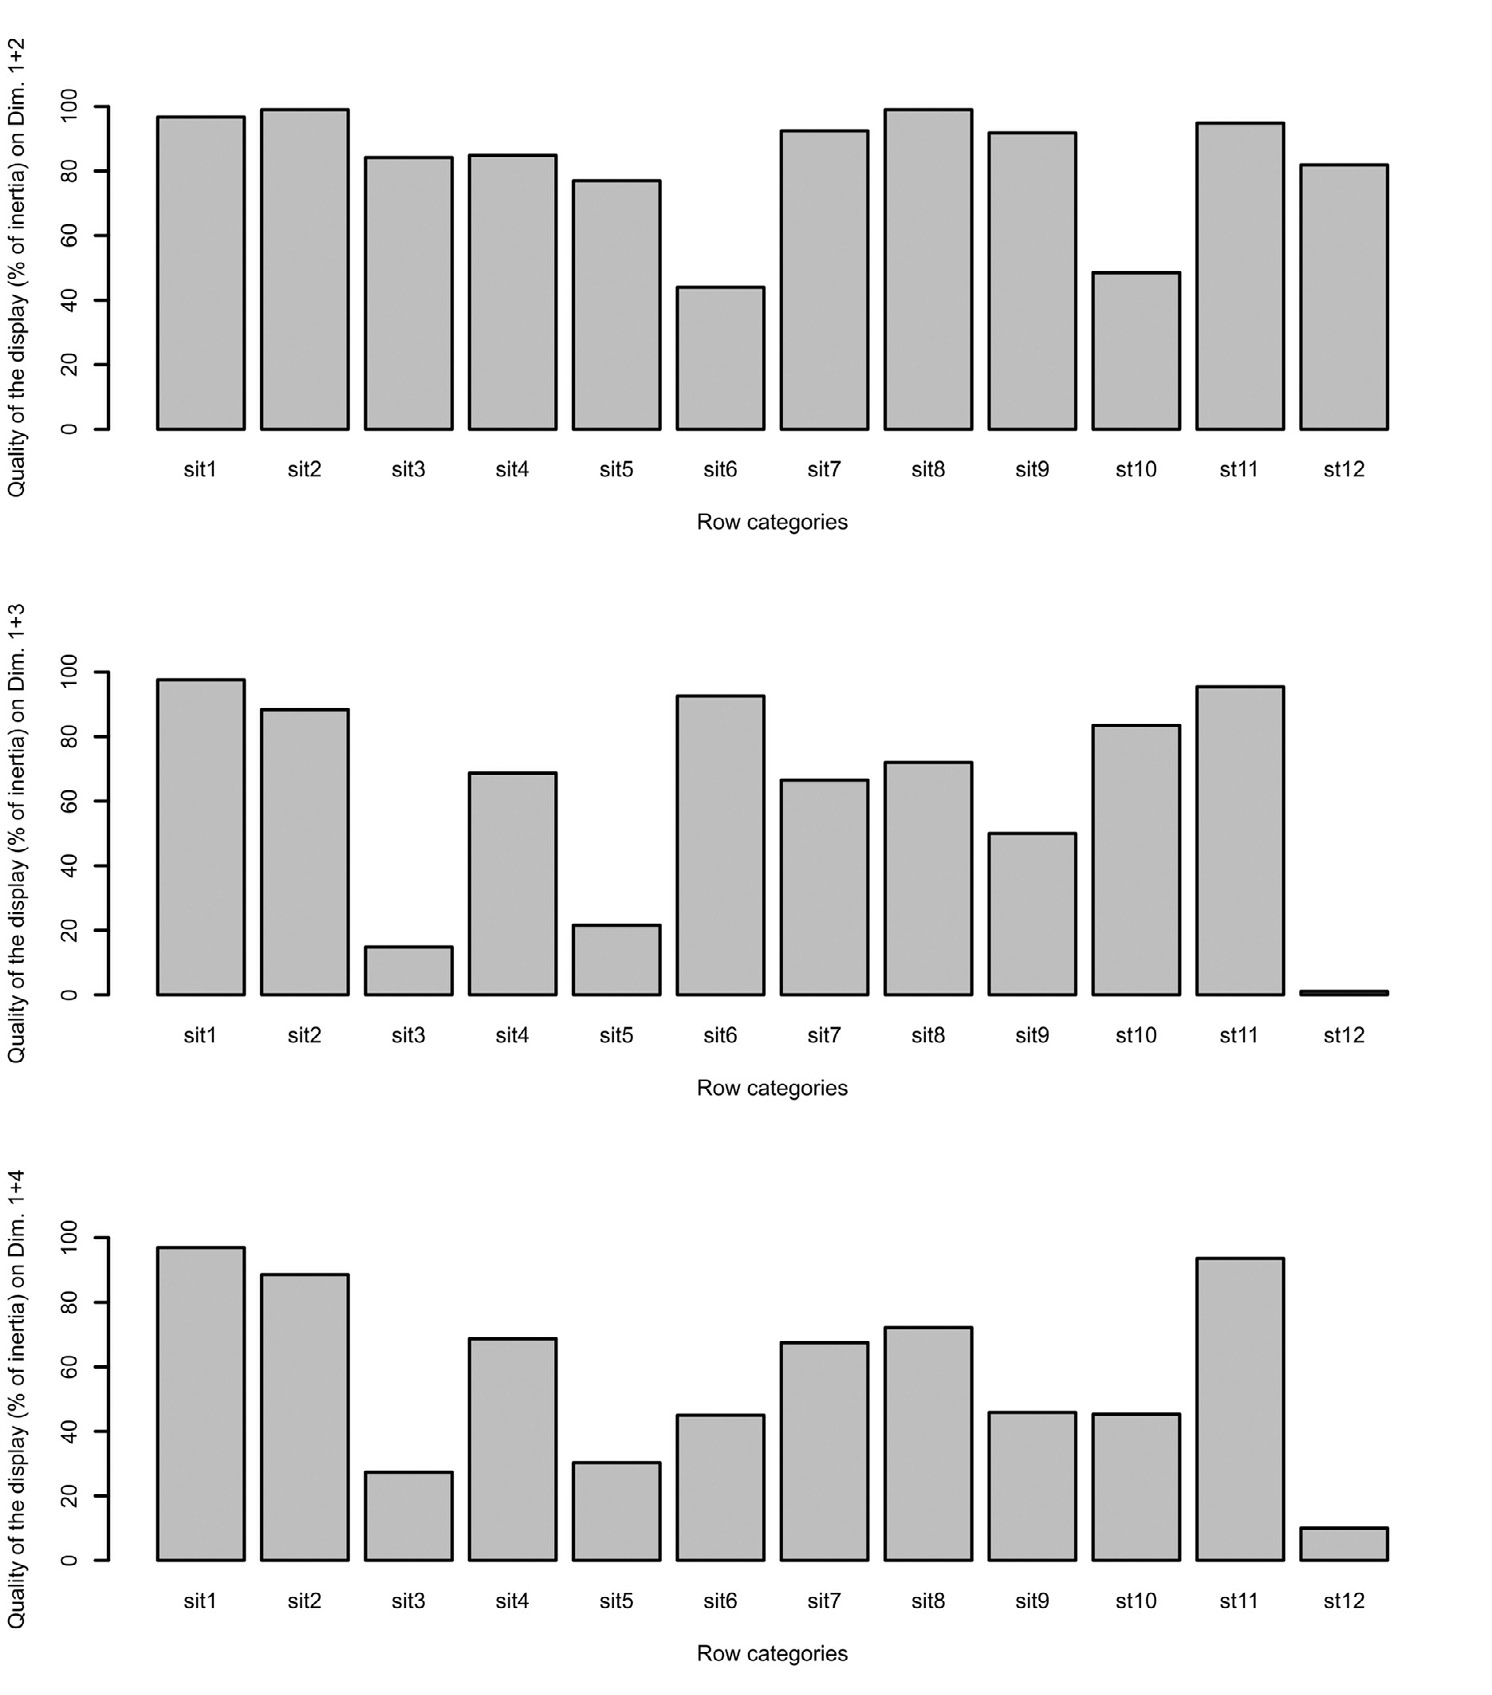
Fig. 4 – CA on data of Tab. 1. Charts provided by the R script. Bar chart showin...
Fig. 5 – CA on data of Tab. 1. Charts provided by the R script. a) CA map showin...
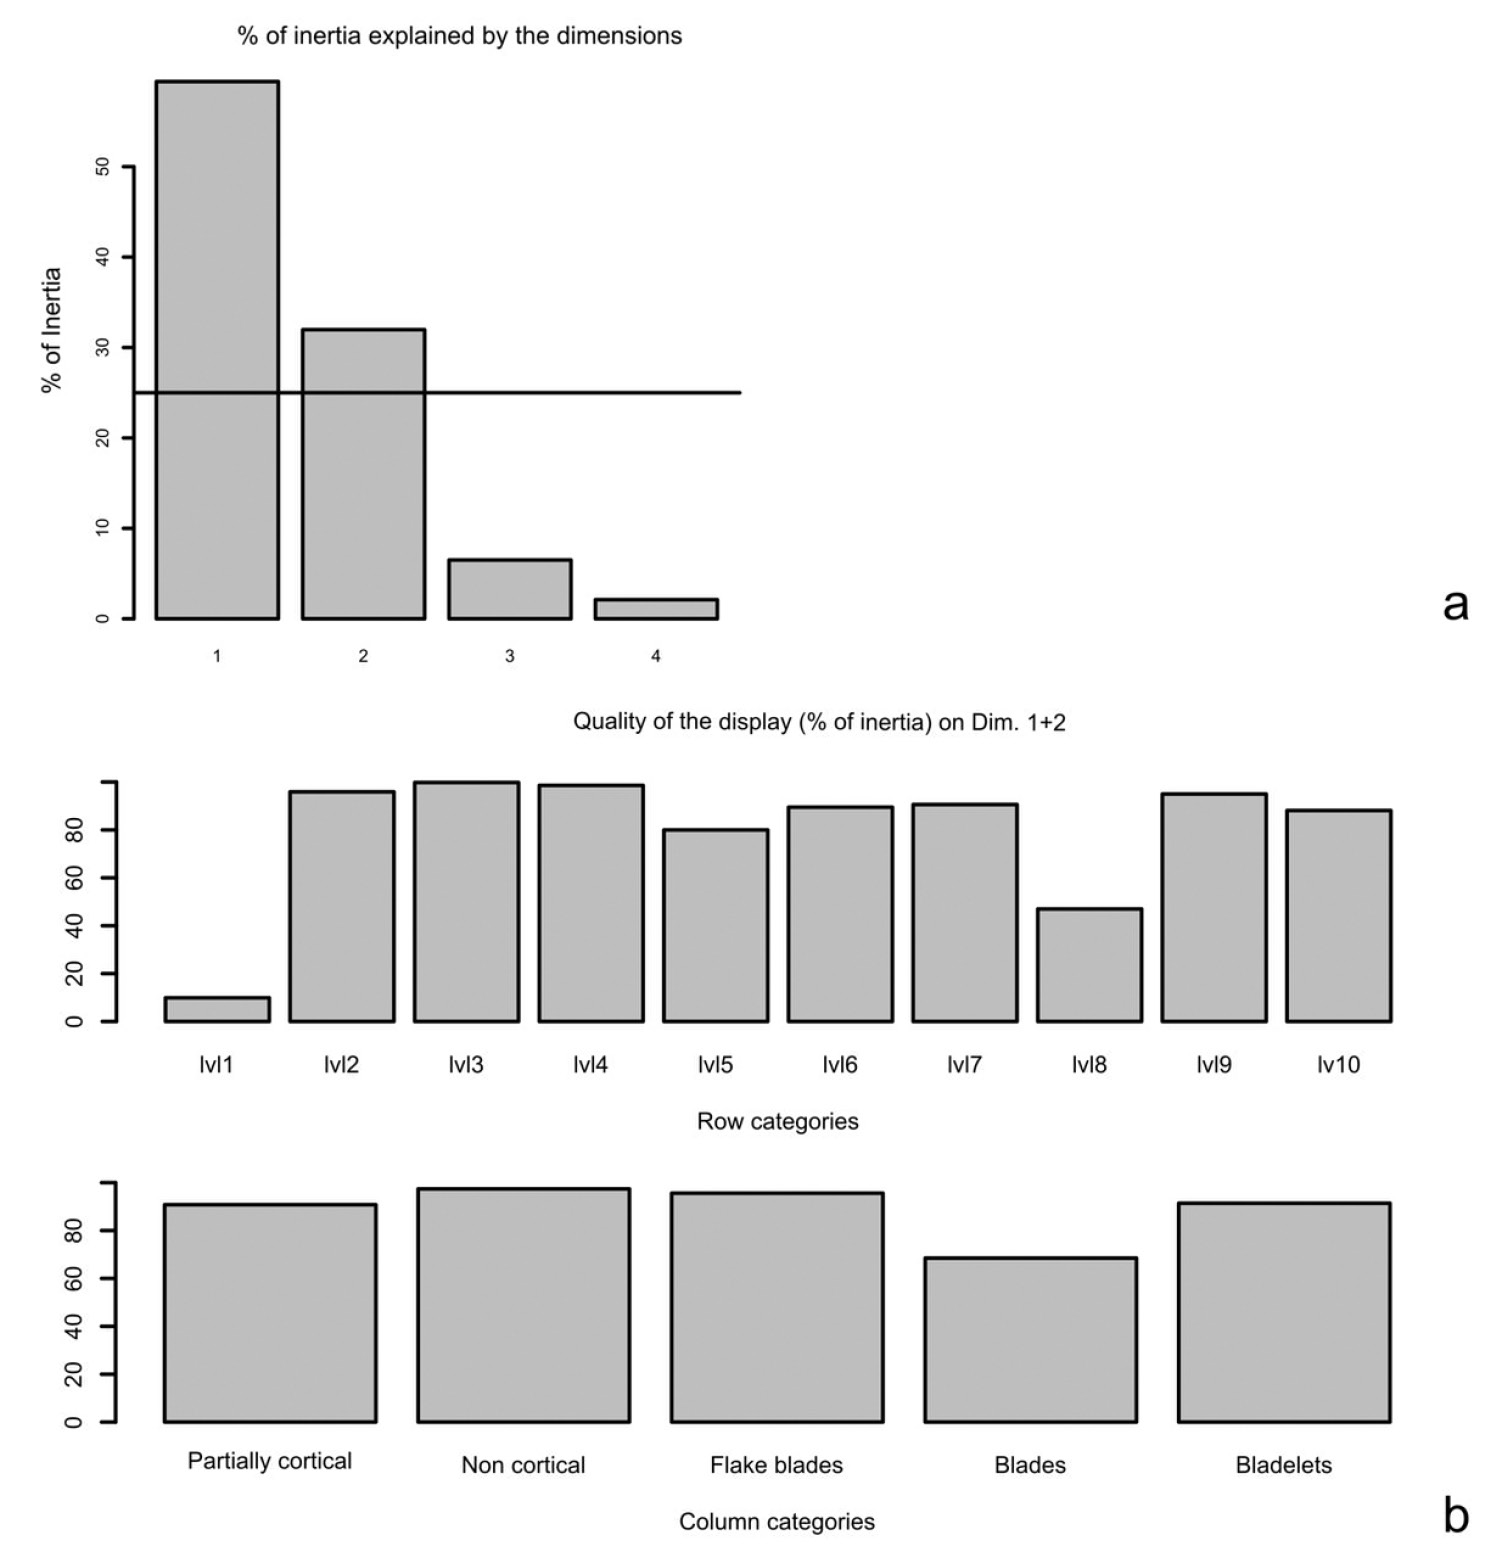
Fig. 6 – CA on data of Tab. 3. a) Percentage of inertia explained by the dimensi...
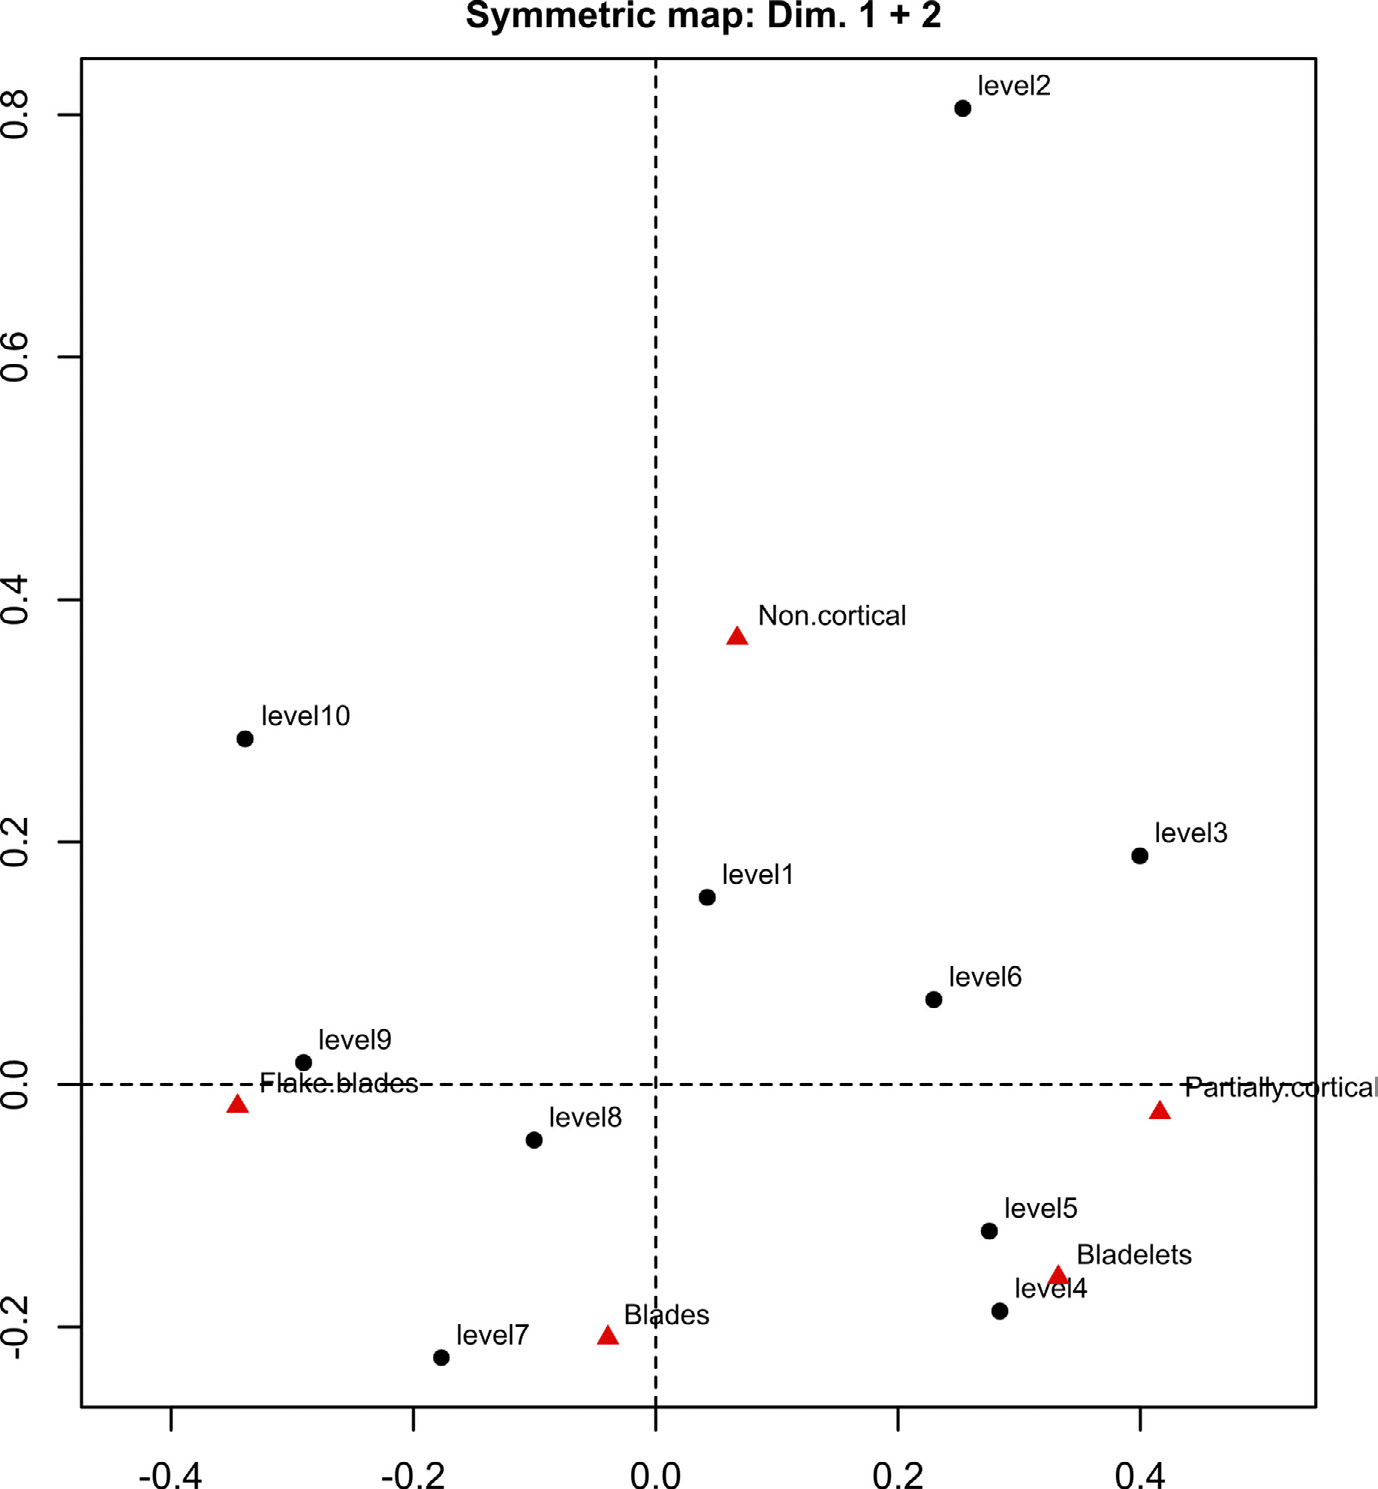
Fig. 7 – Symmetric map of CA on Tab. 3, showing the first 2 dimensions.
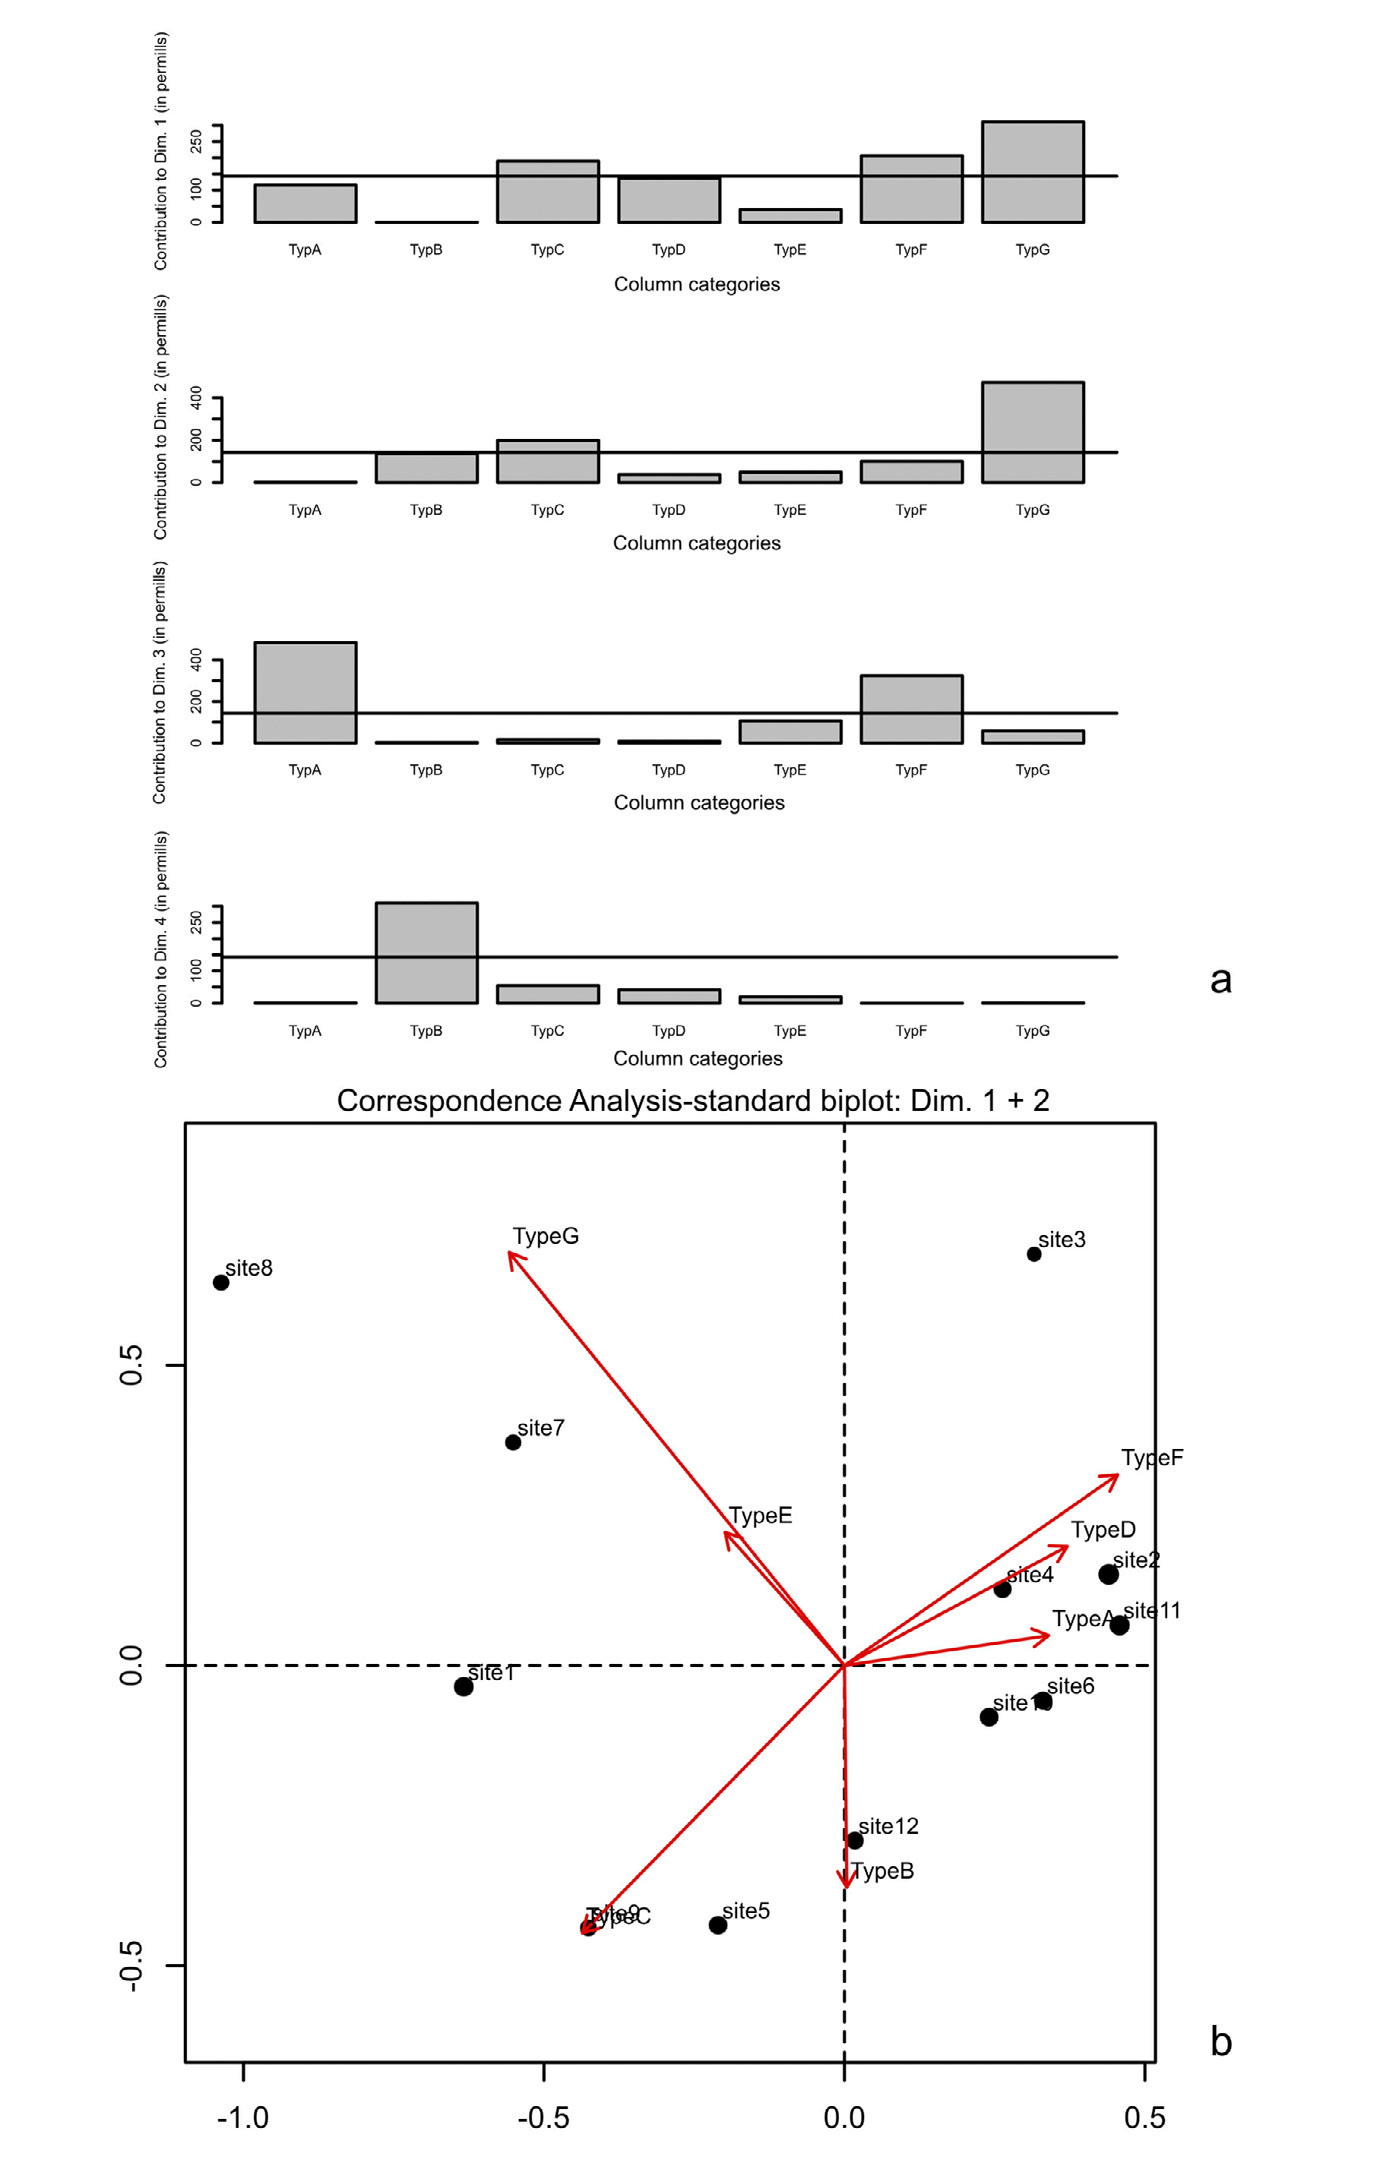
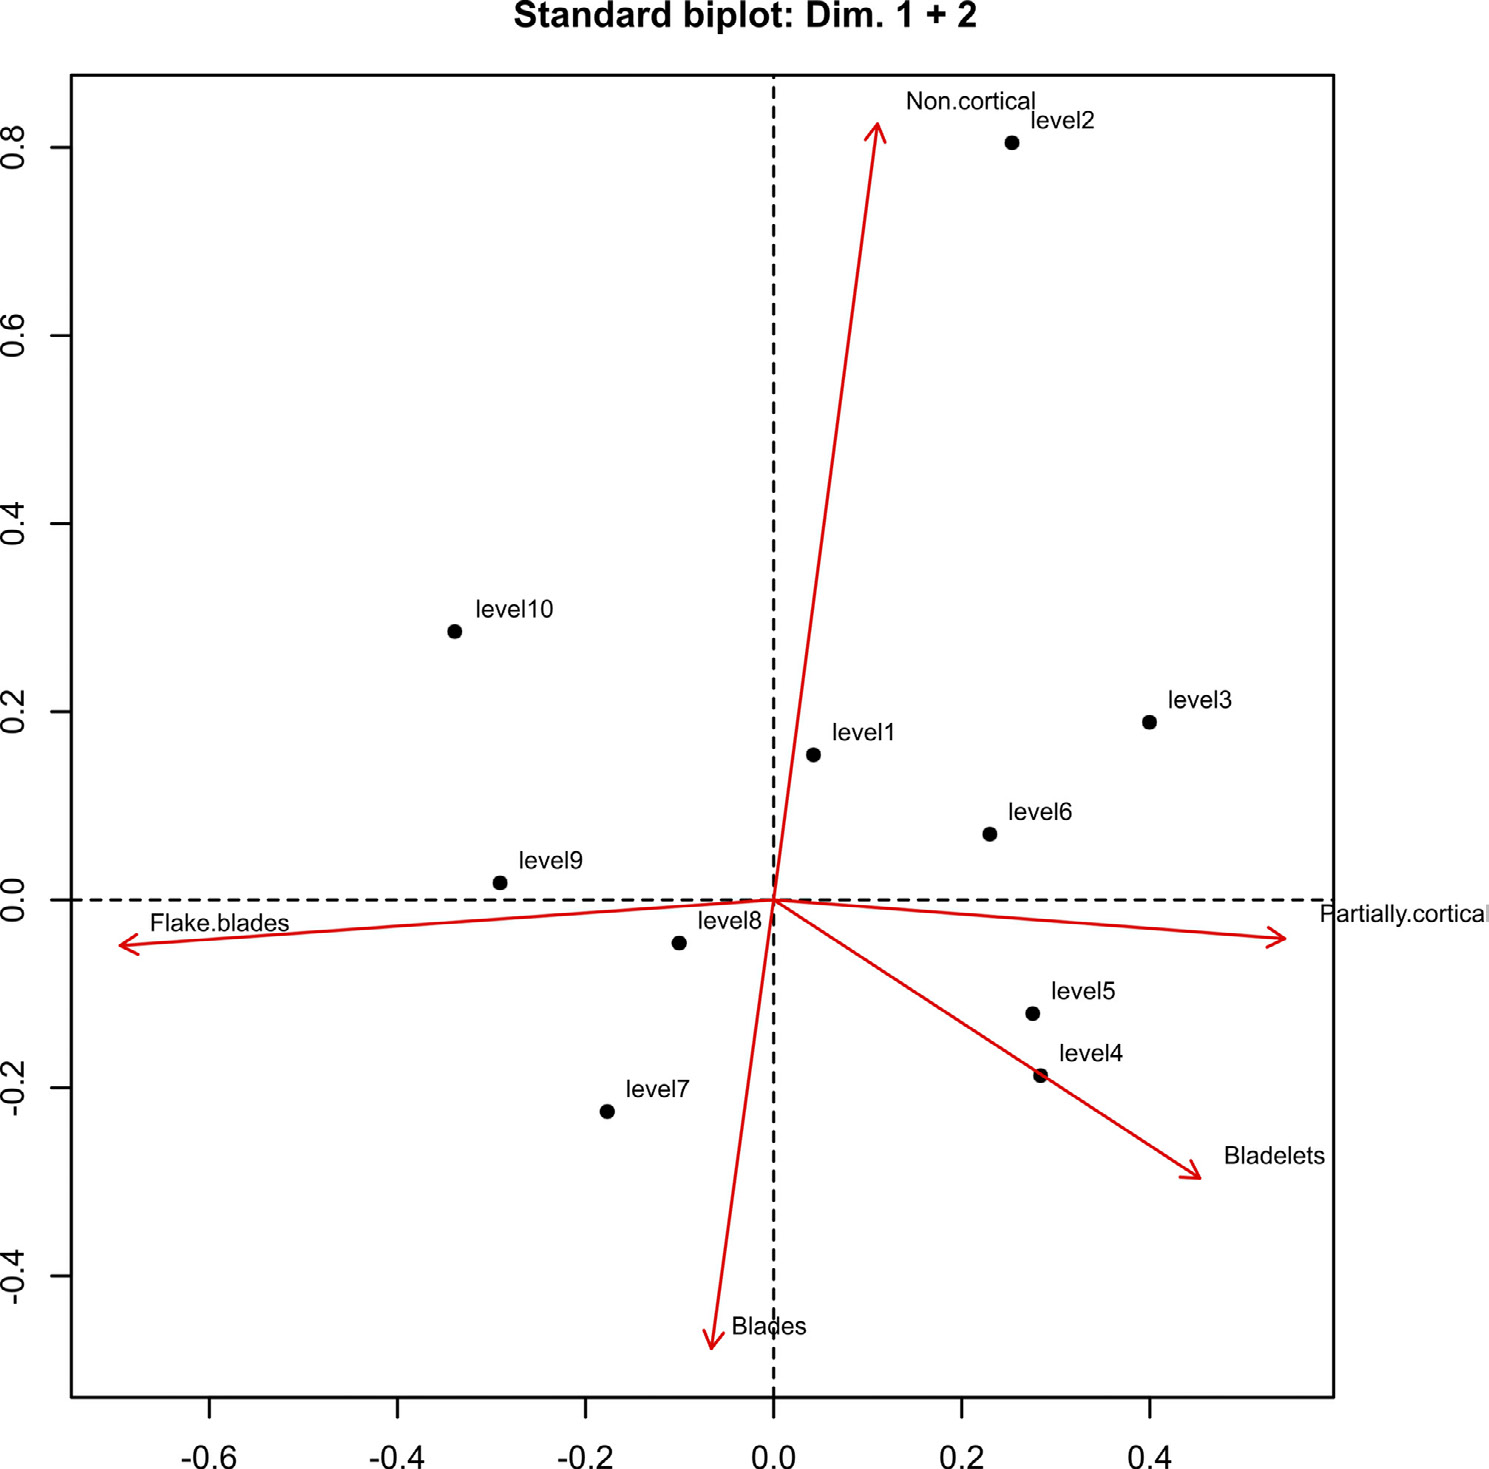
Fig. 8 – Standard Biplot of CA on Tab. 3, showing the first two dimensions. For ...
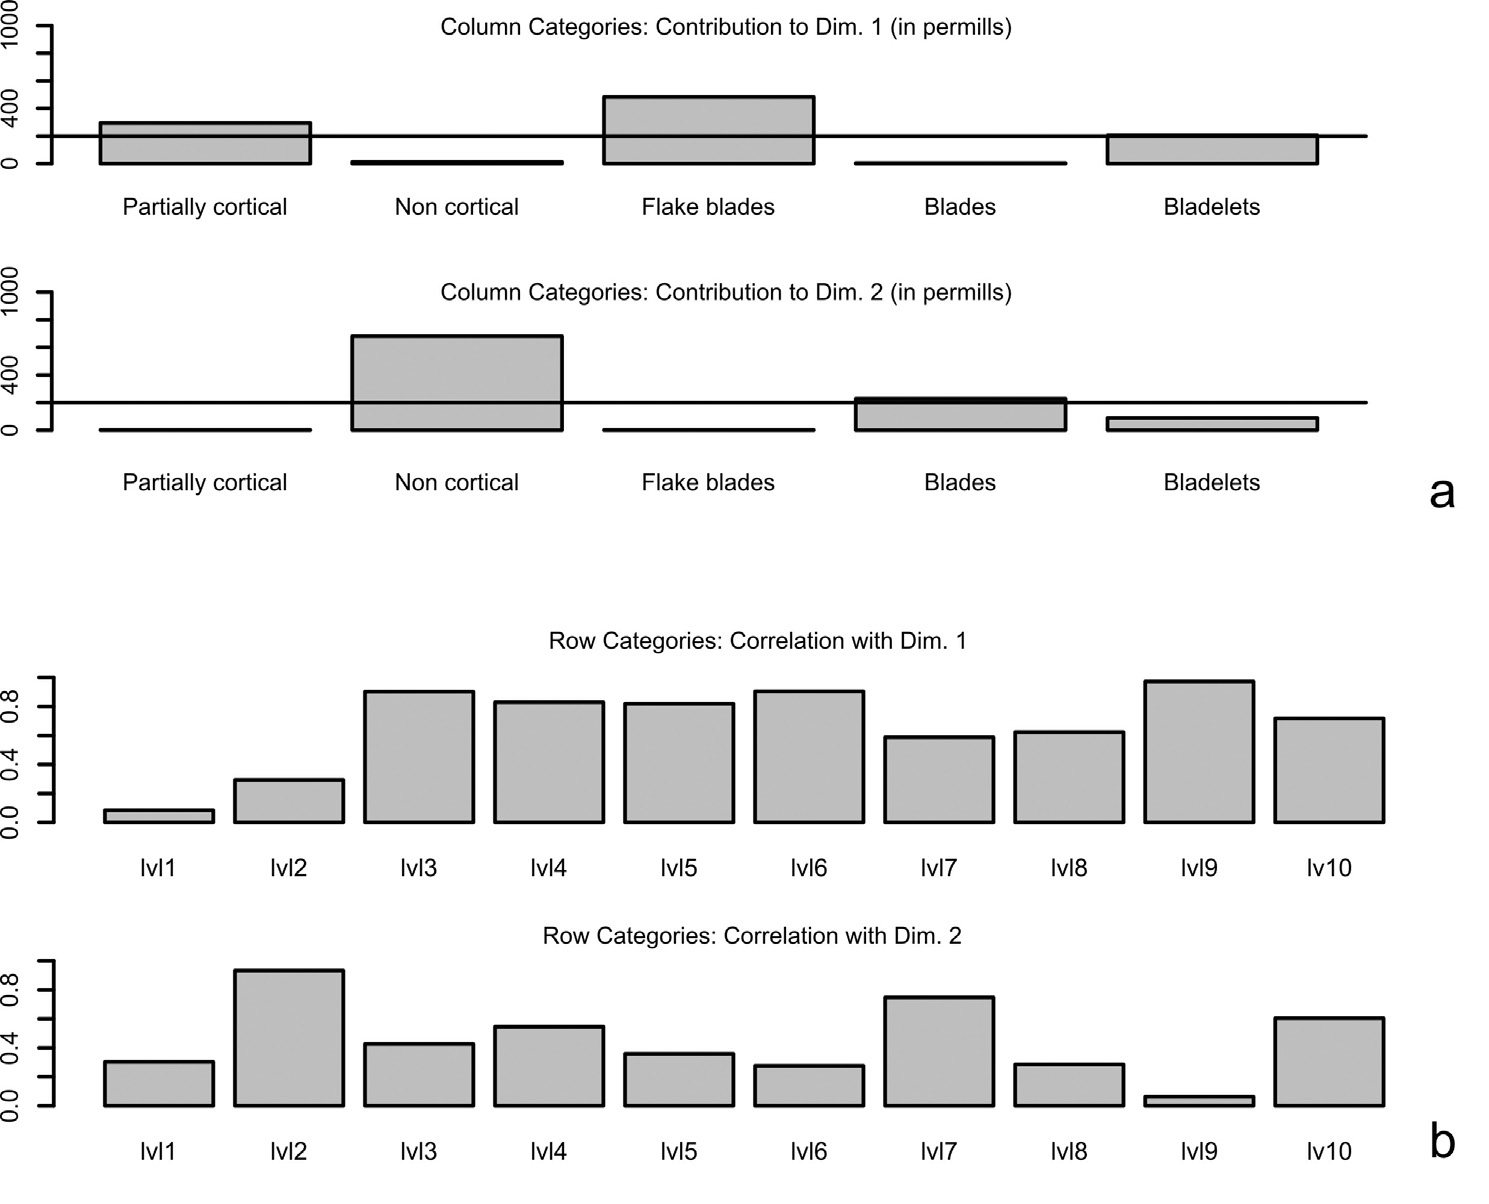
Fig. 9 – a) Histograms showing the contribution (in permills) of the column cate...
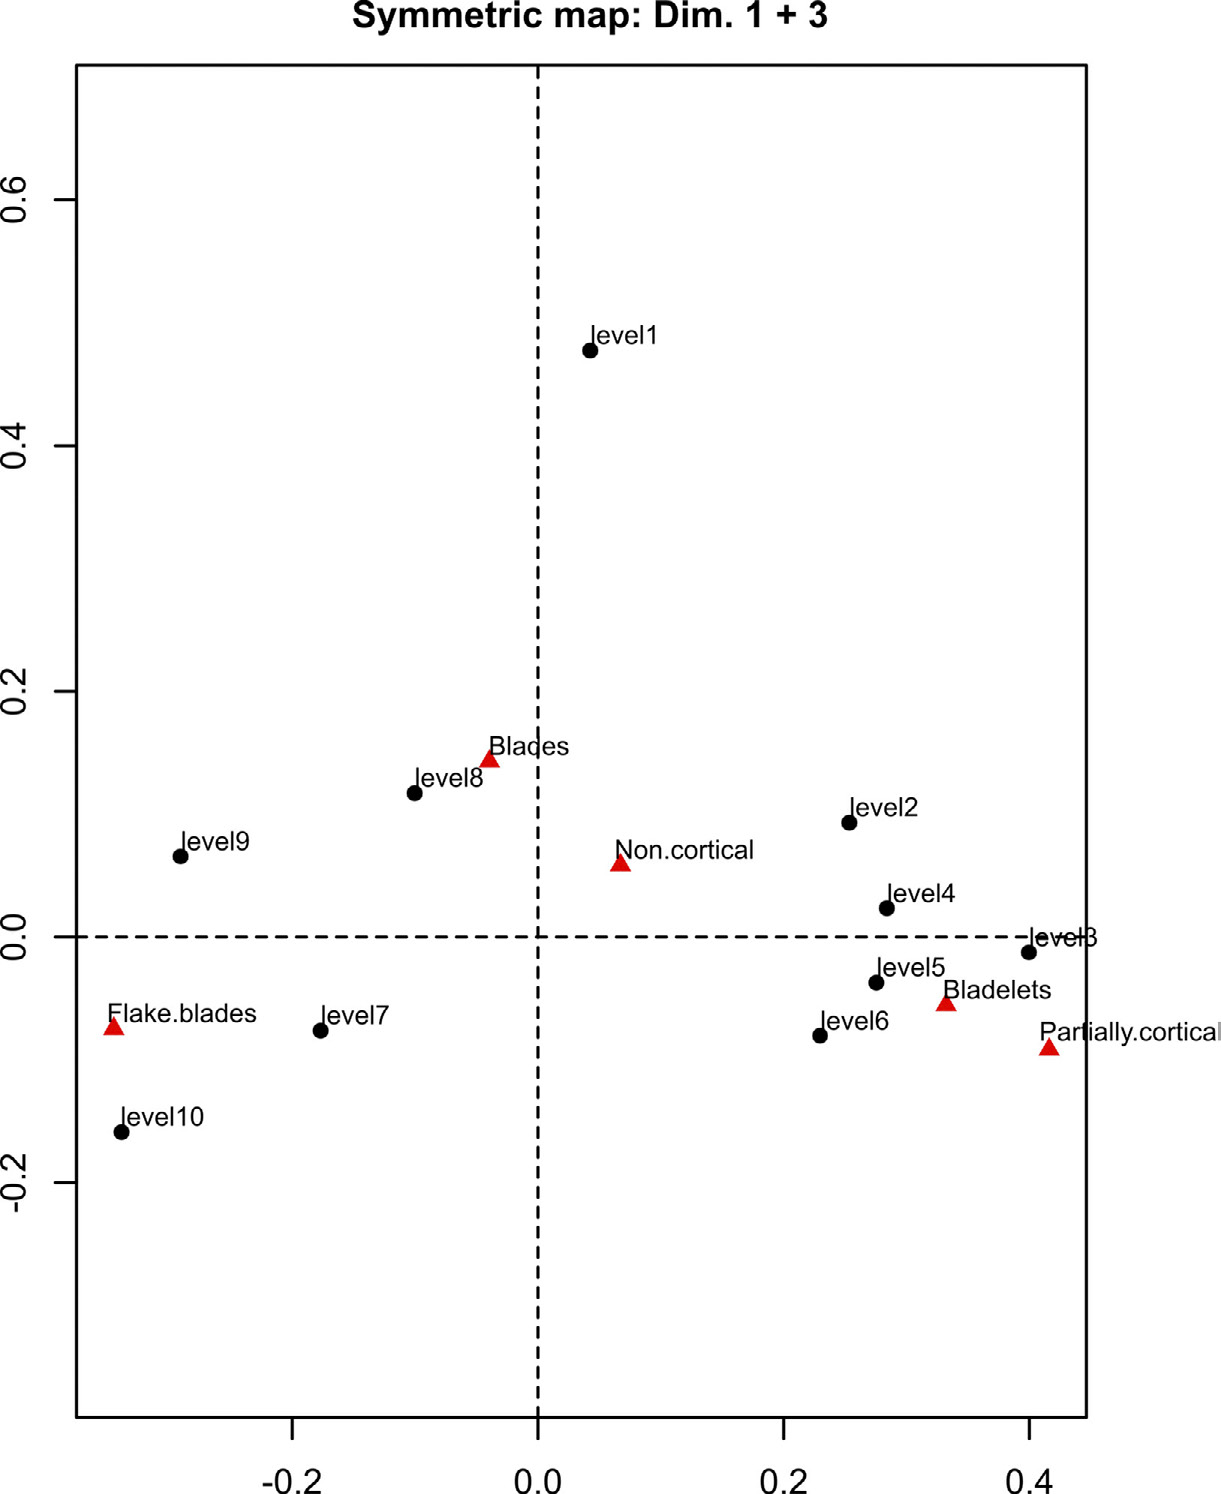
Fig. 10 – Symmetric map of CA on Tab. 3, showing (just for illustrative purposes...
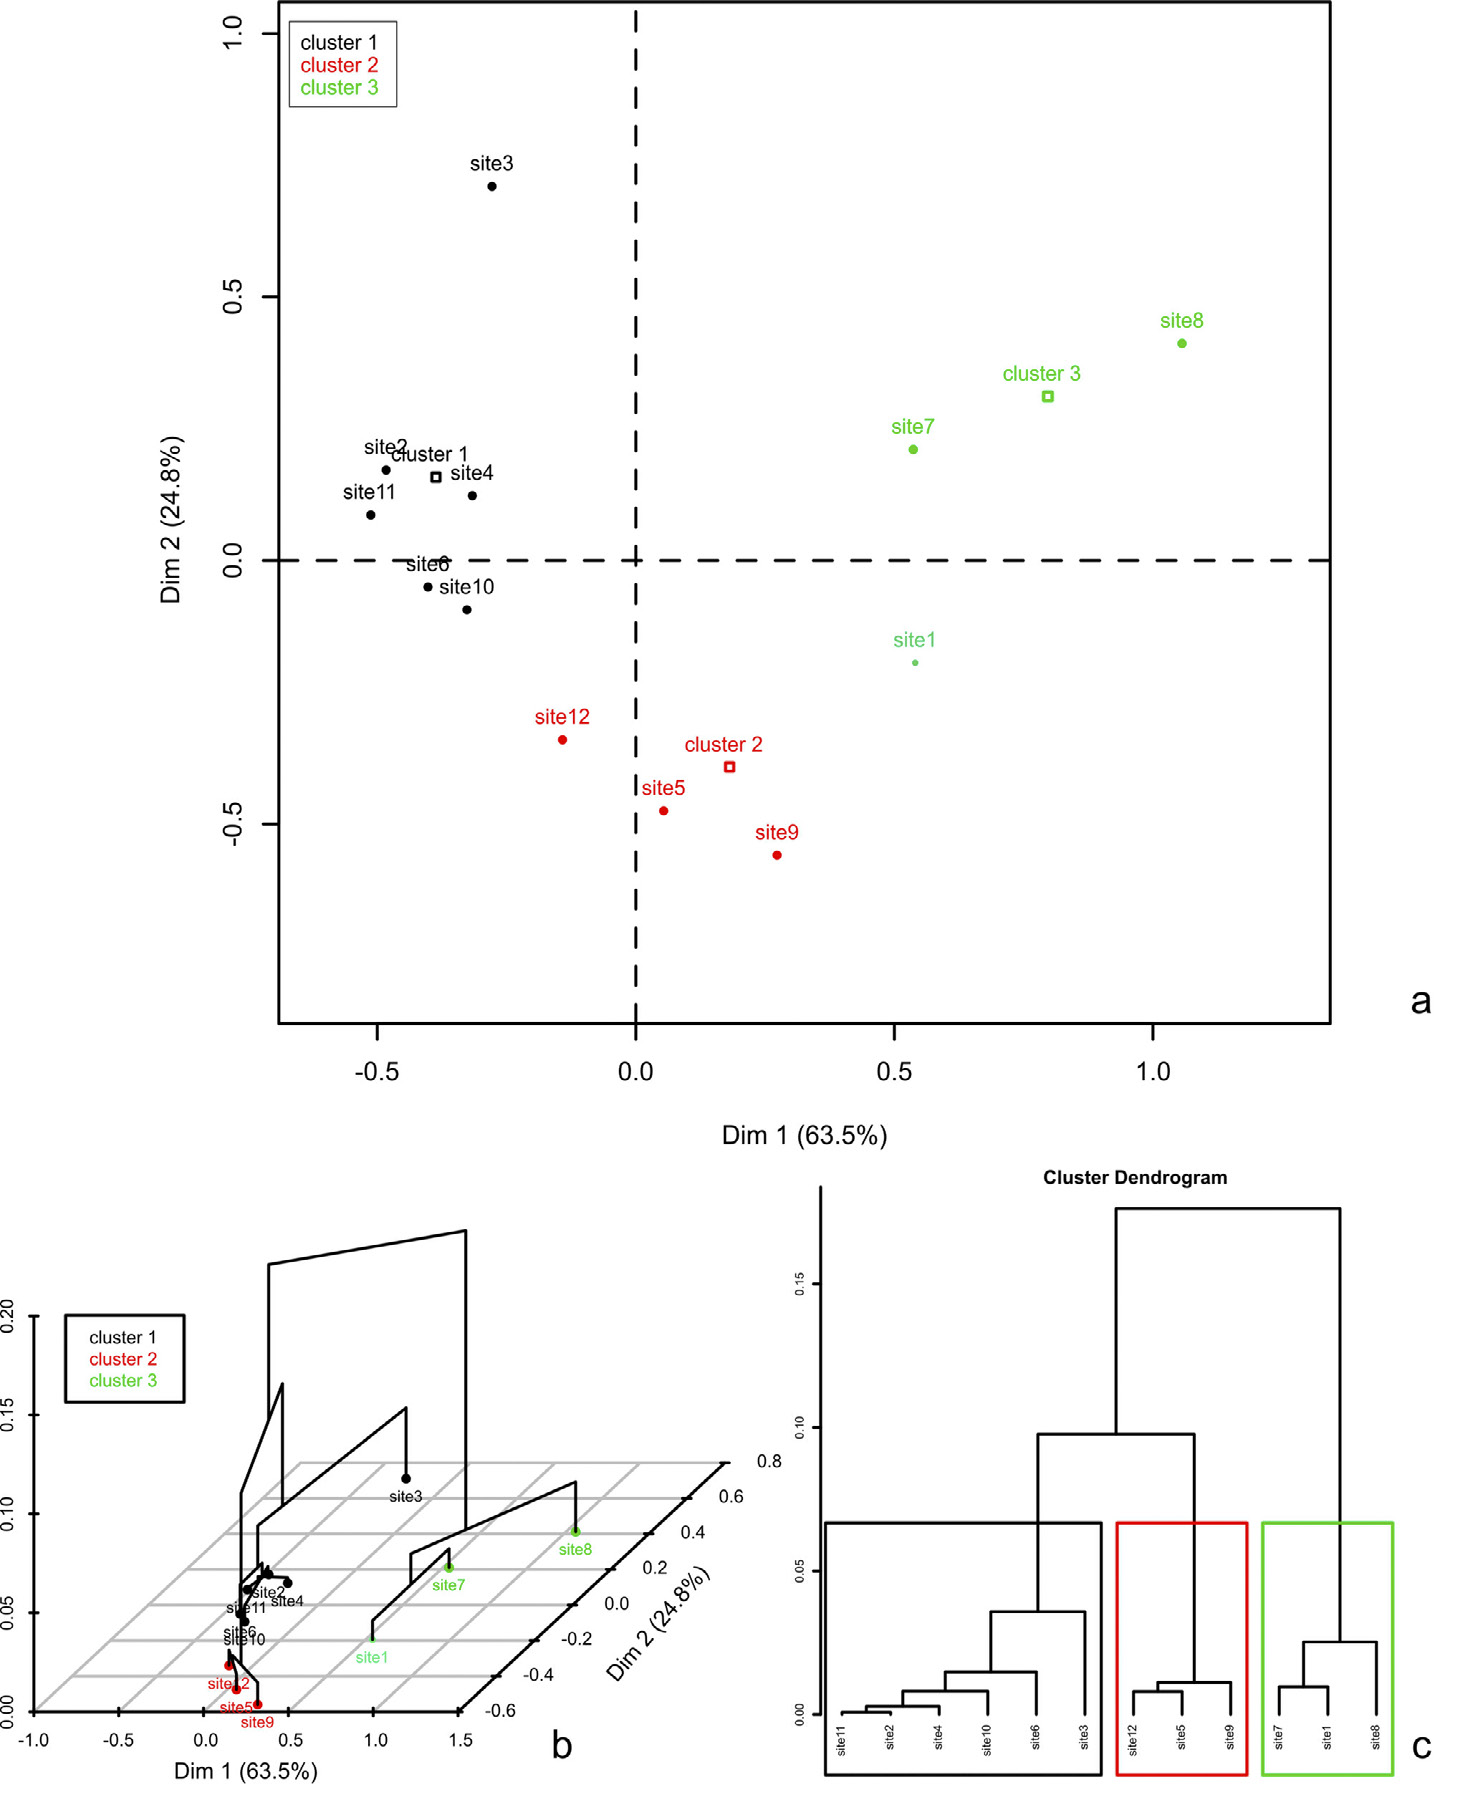
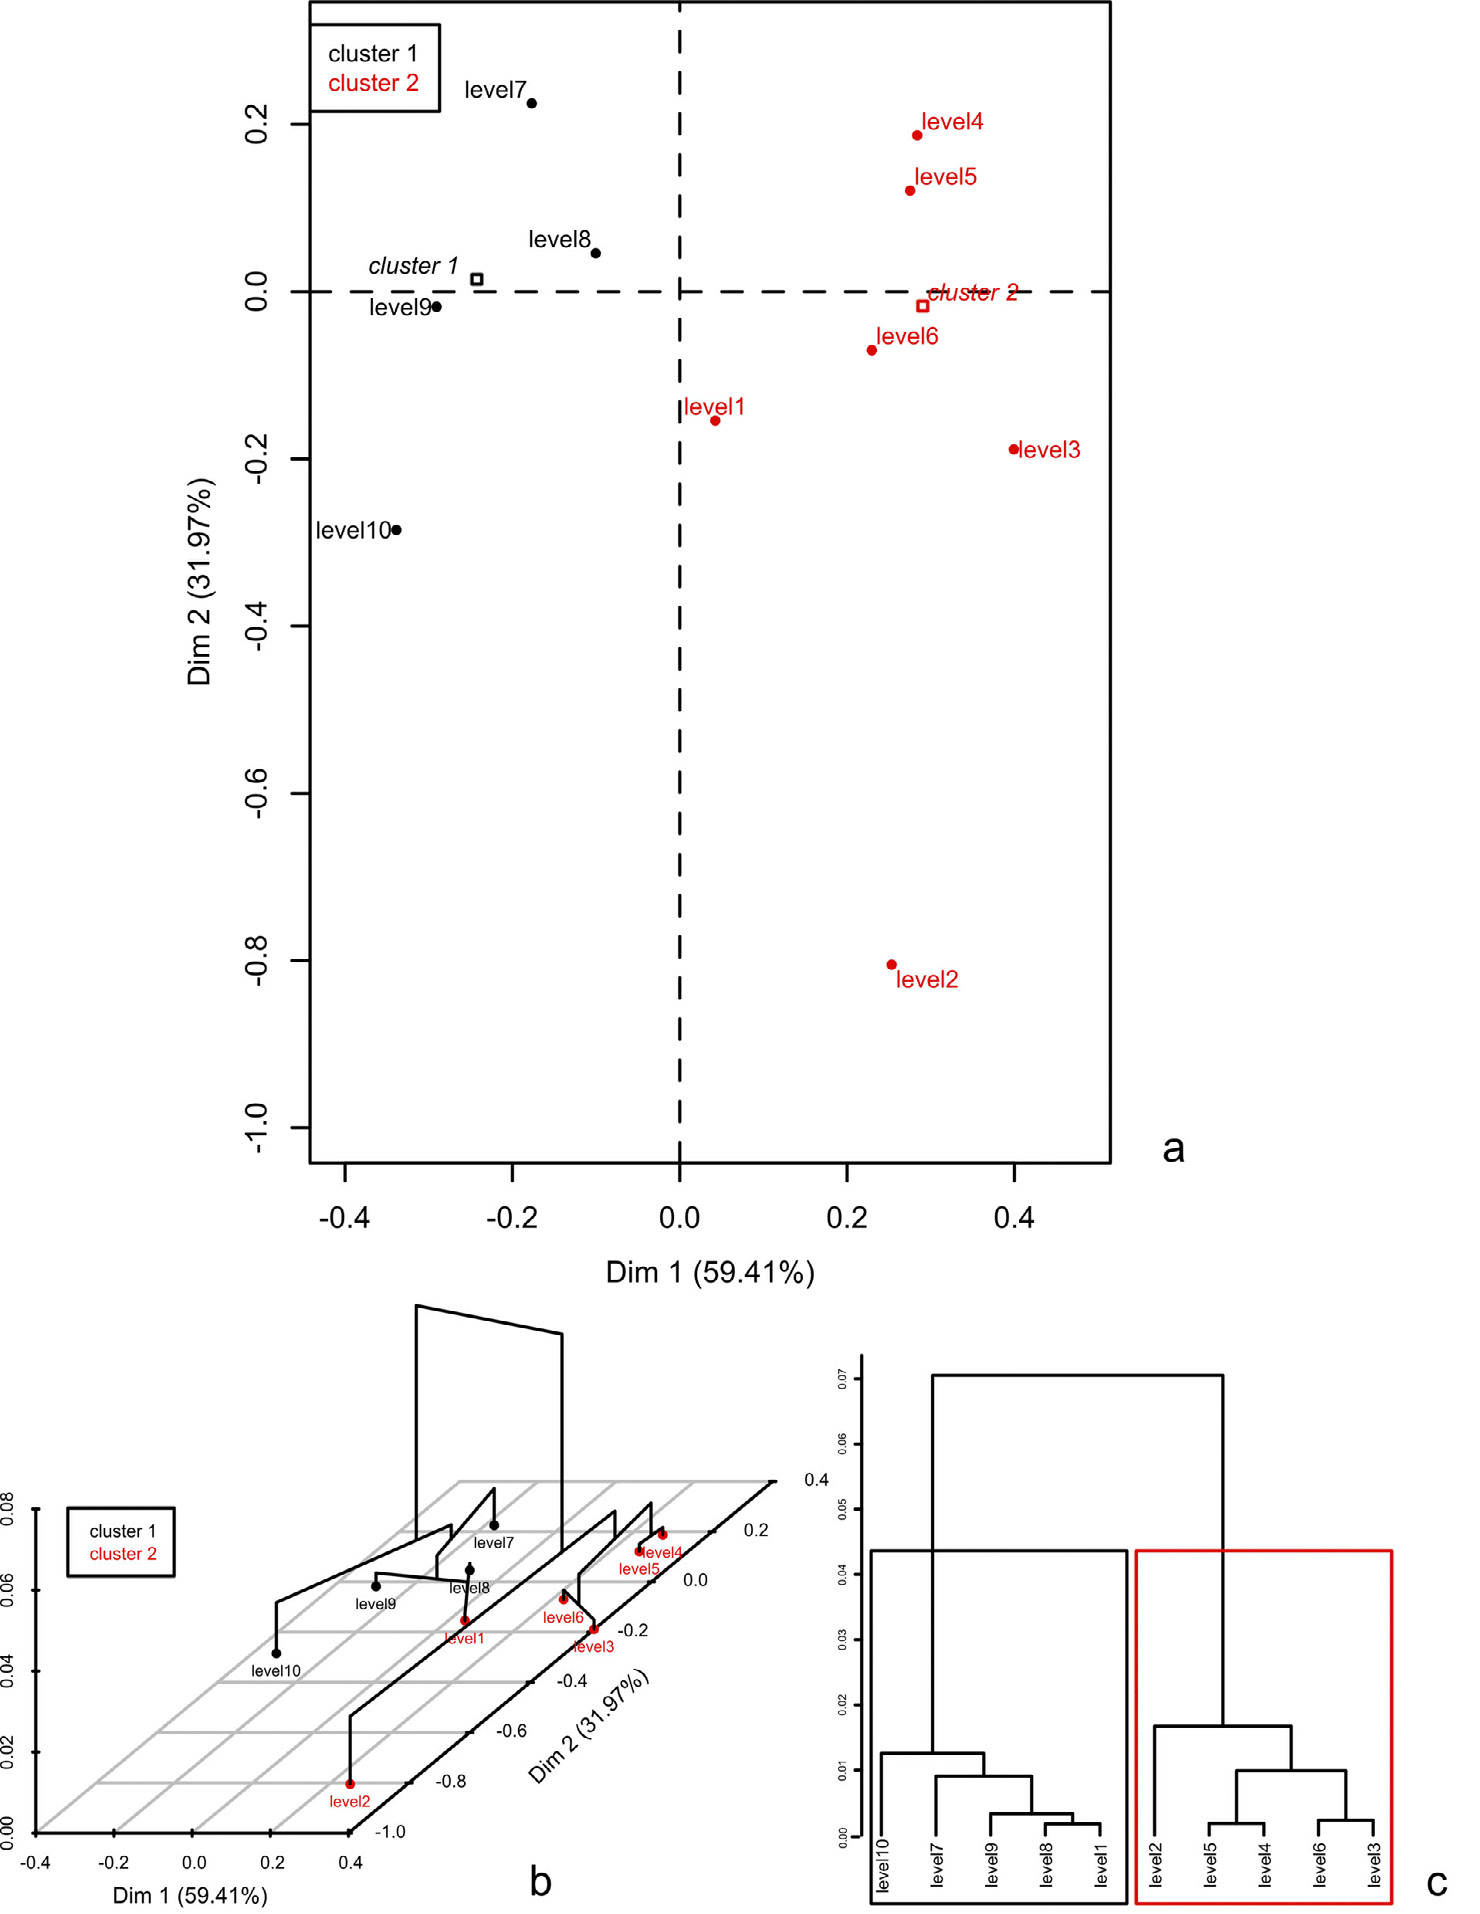
Fig. 11 – Hierarchical clustering of row categories of Tab. 3. a) CA map showing...
Alberti G. 2013, An R script to facilitate Correspondence Analysis. A guide to the use and the interpretation of results from an archaeological perspective, Archeologia e Calcolatori 24