IADI Image
Metadata
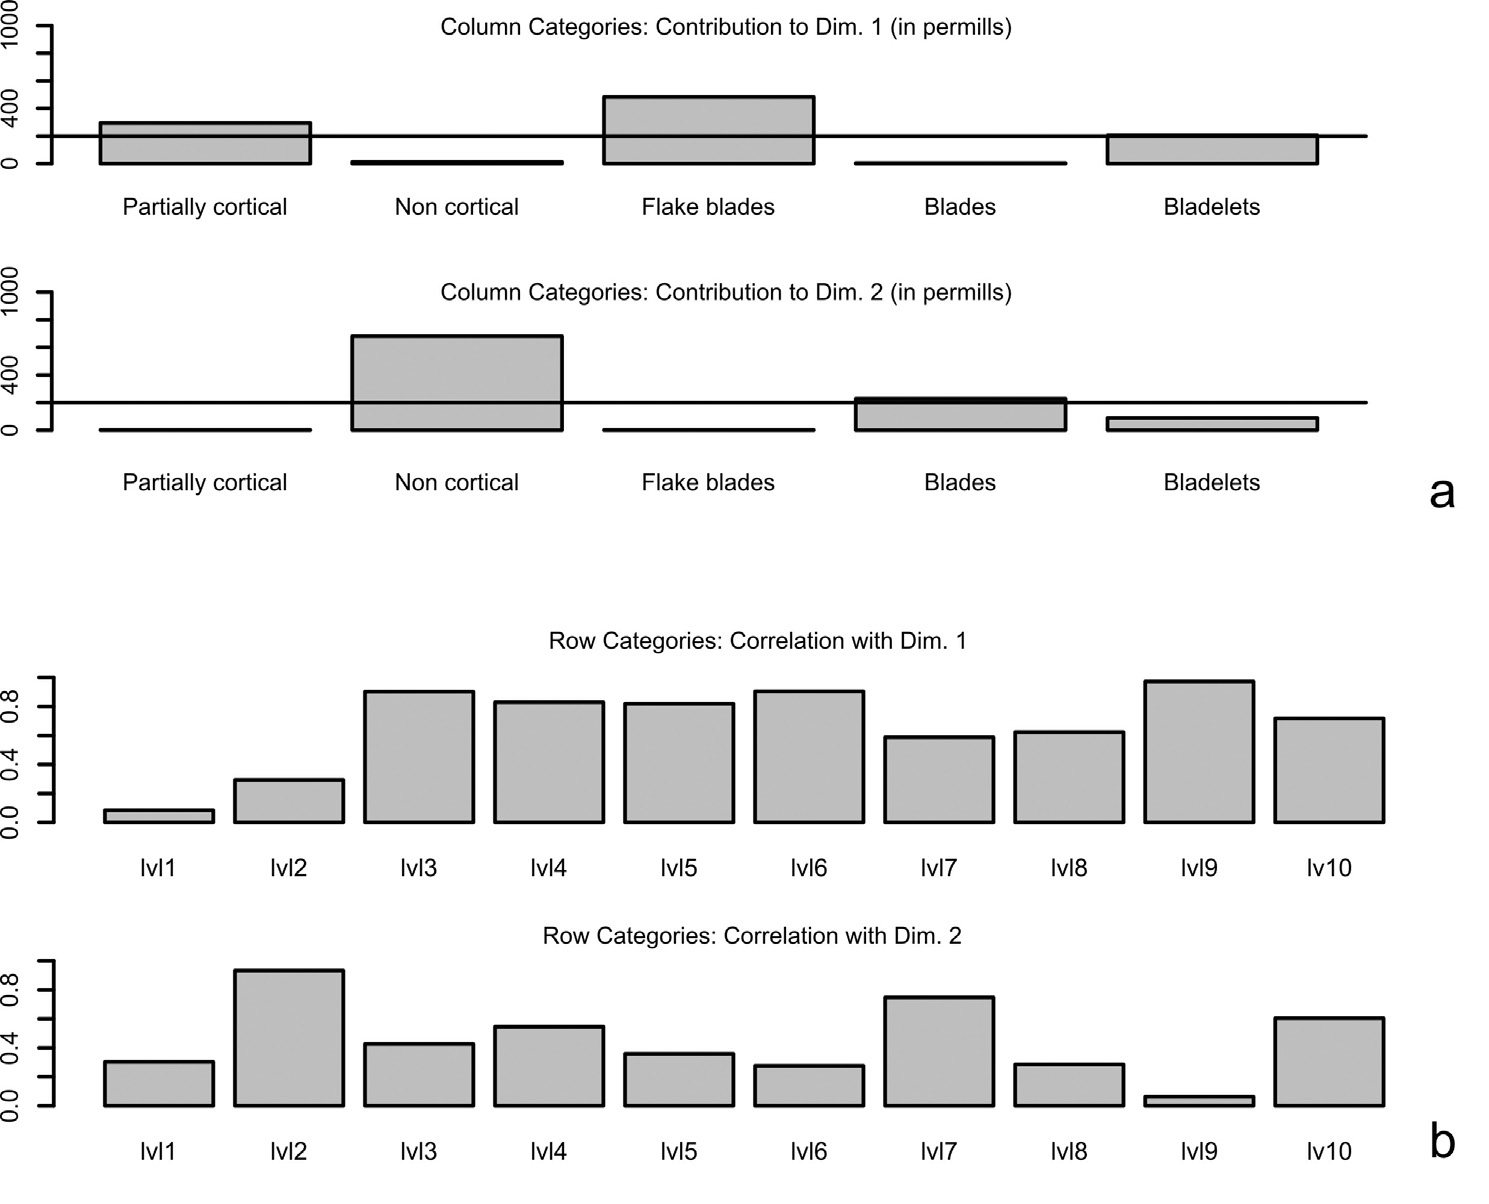
| Caption | a) Histograms showing the contribution (in permills) of the column categories of Tab. 3 (i.e., lithic types) to the definition of the first two CA dimensions. Reference line: average contribution. b) Histograms showing the correlation of row categories (i.e., archaeological levels) with the first two CA dimensions. |
| Figure number | 9 |
| Article | An R script to facilitate Correspondence Analysis. A guide to the use and the interpretation of results from an archaeological perspective |
| Authors | Alberti G. |
| Volume | Volume 24 |