IADI Image
Metadata
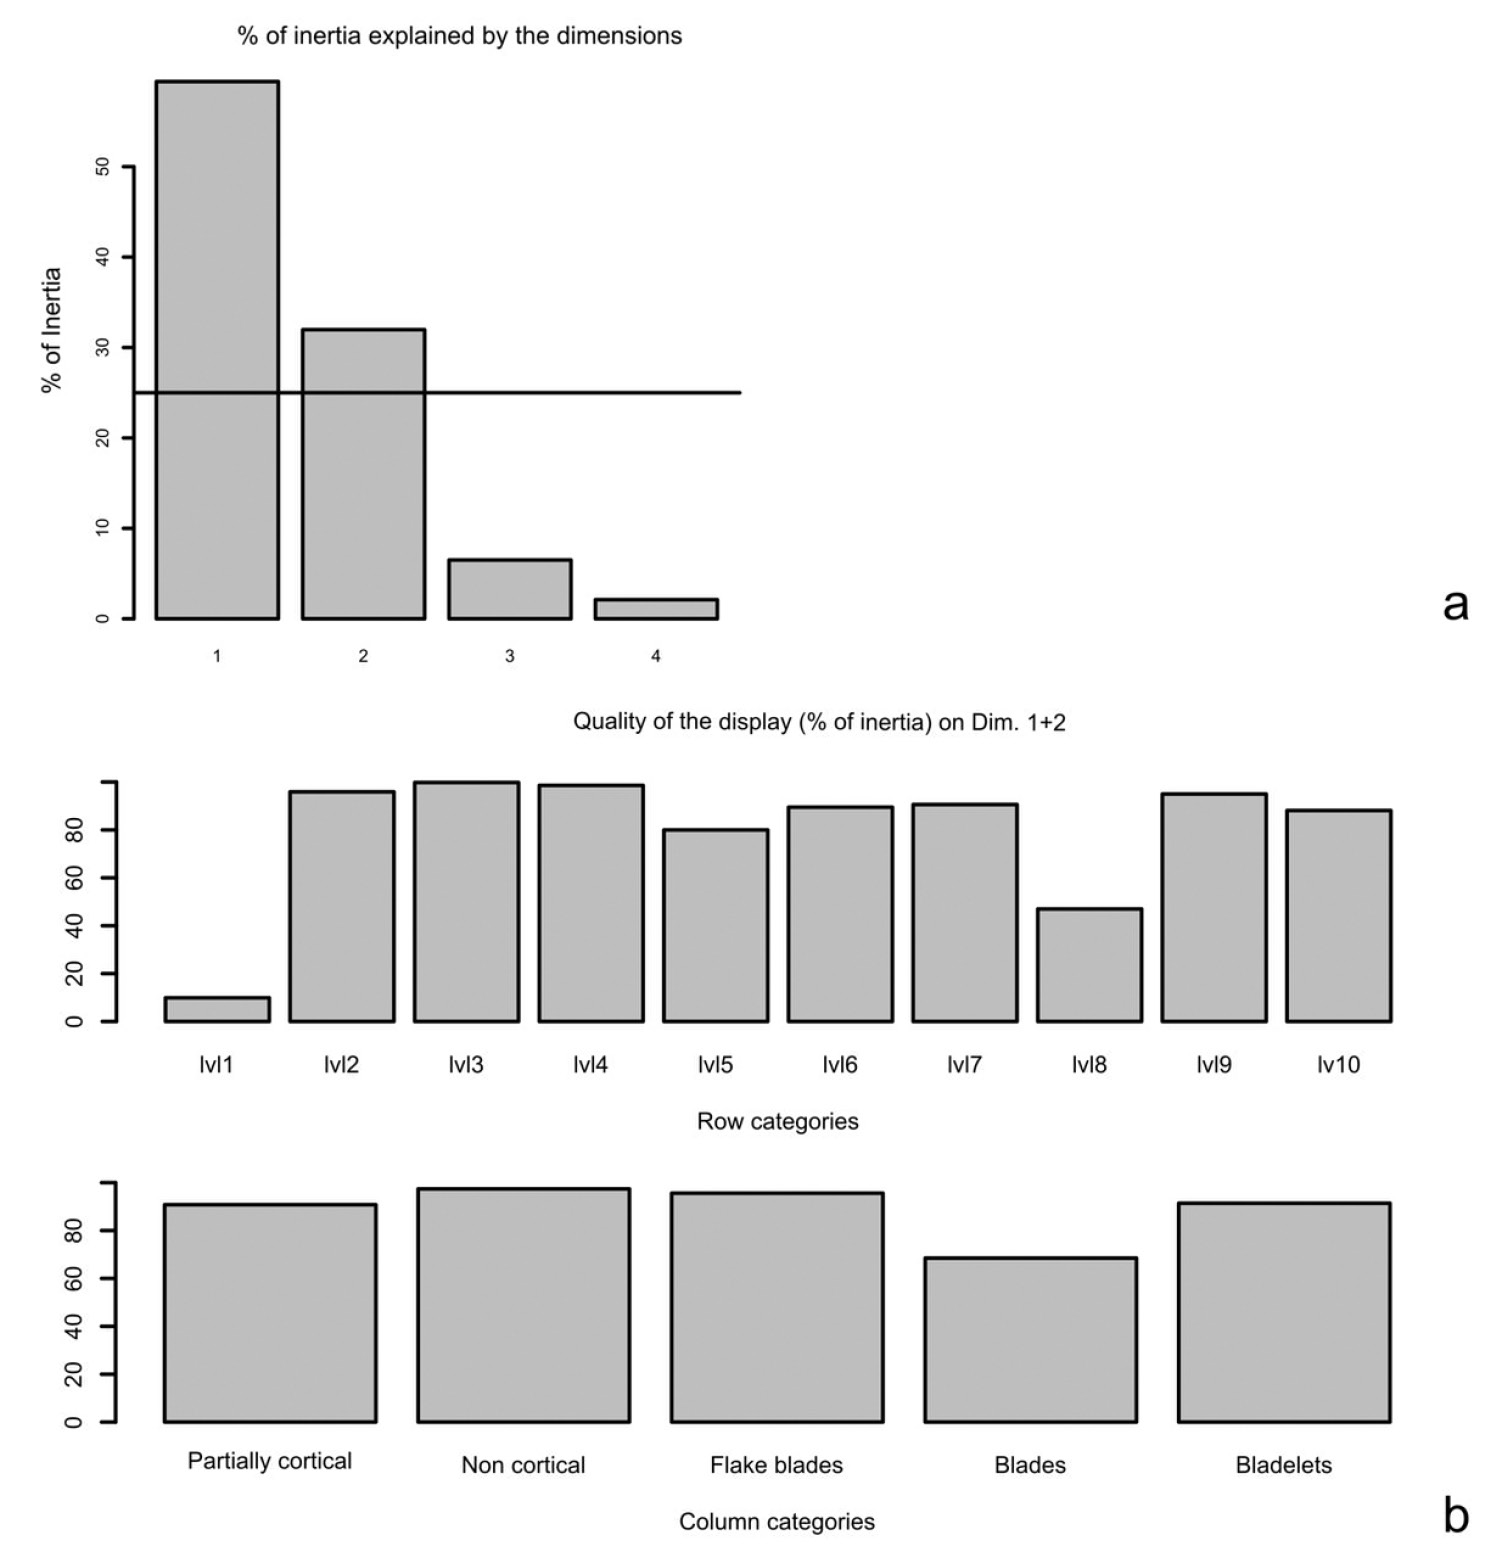
| Caption | CA on data of Tab. 3. a) Percentage of inertia explained by the dimensions. Reference line: threshold above which a dimension should be considered important for data interpretation according to the average rule. b) Histograms showing the quality of the display of row and column categories on the first two CA dimensions. |
| Figure number | 6 |
| Article | An R script to facilitate Correspondence Analysis. A guide to the use and the interpretation of results from an archaeological perspective |
| Authors | Alberti G. |
| Volume | Volume 24 |