IADI Image
Metadata
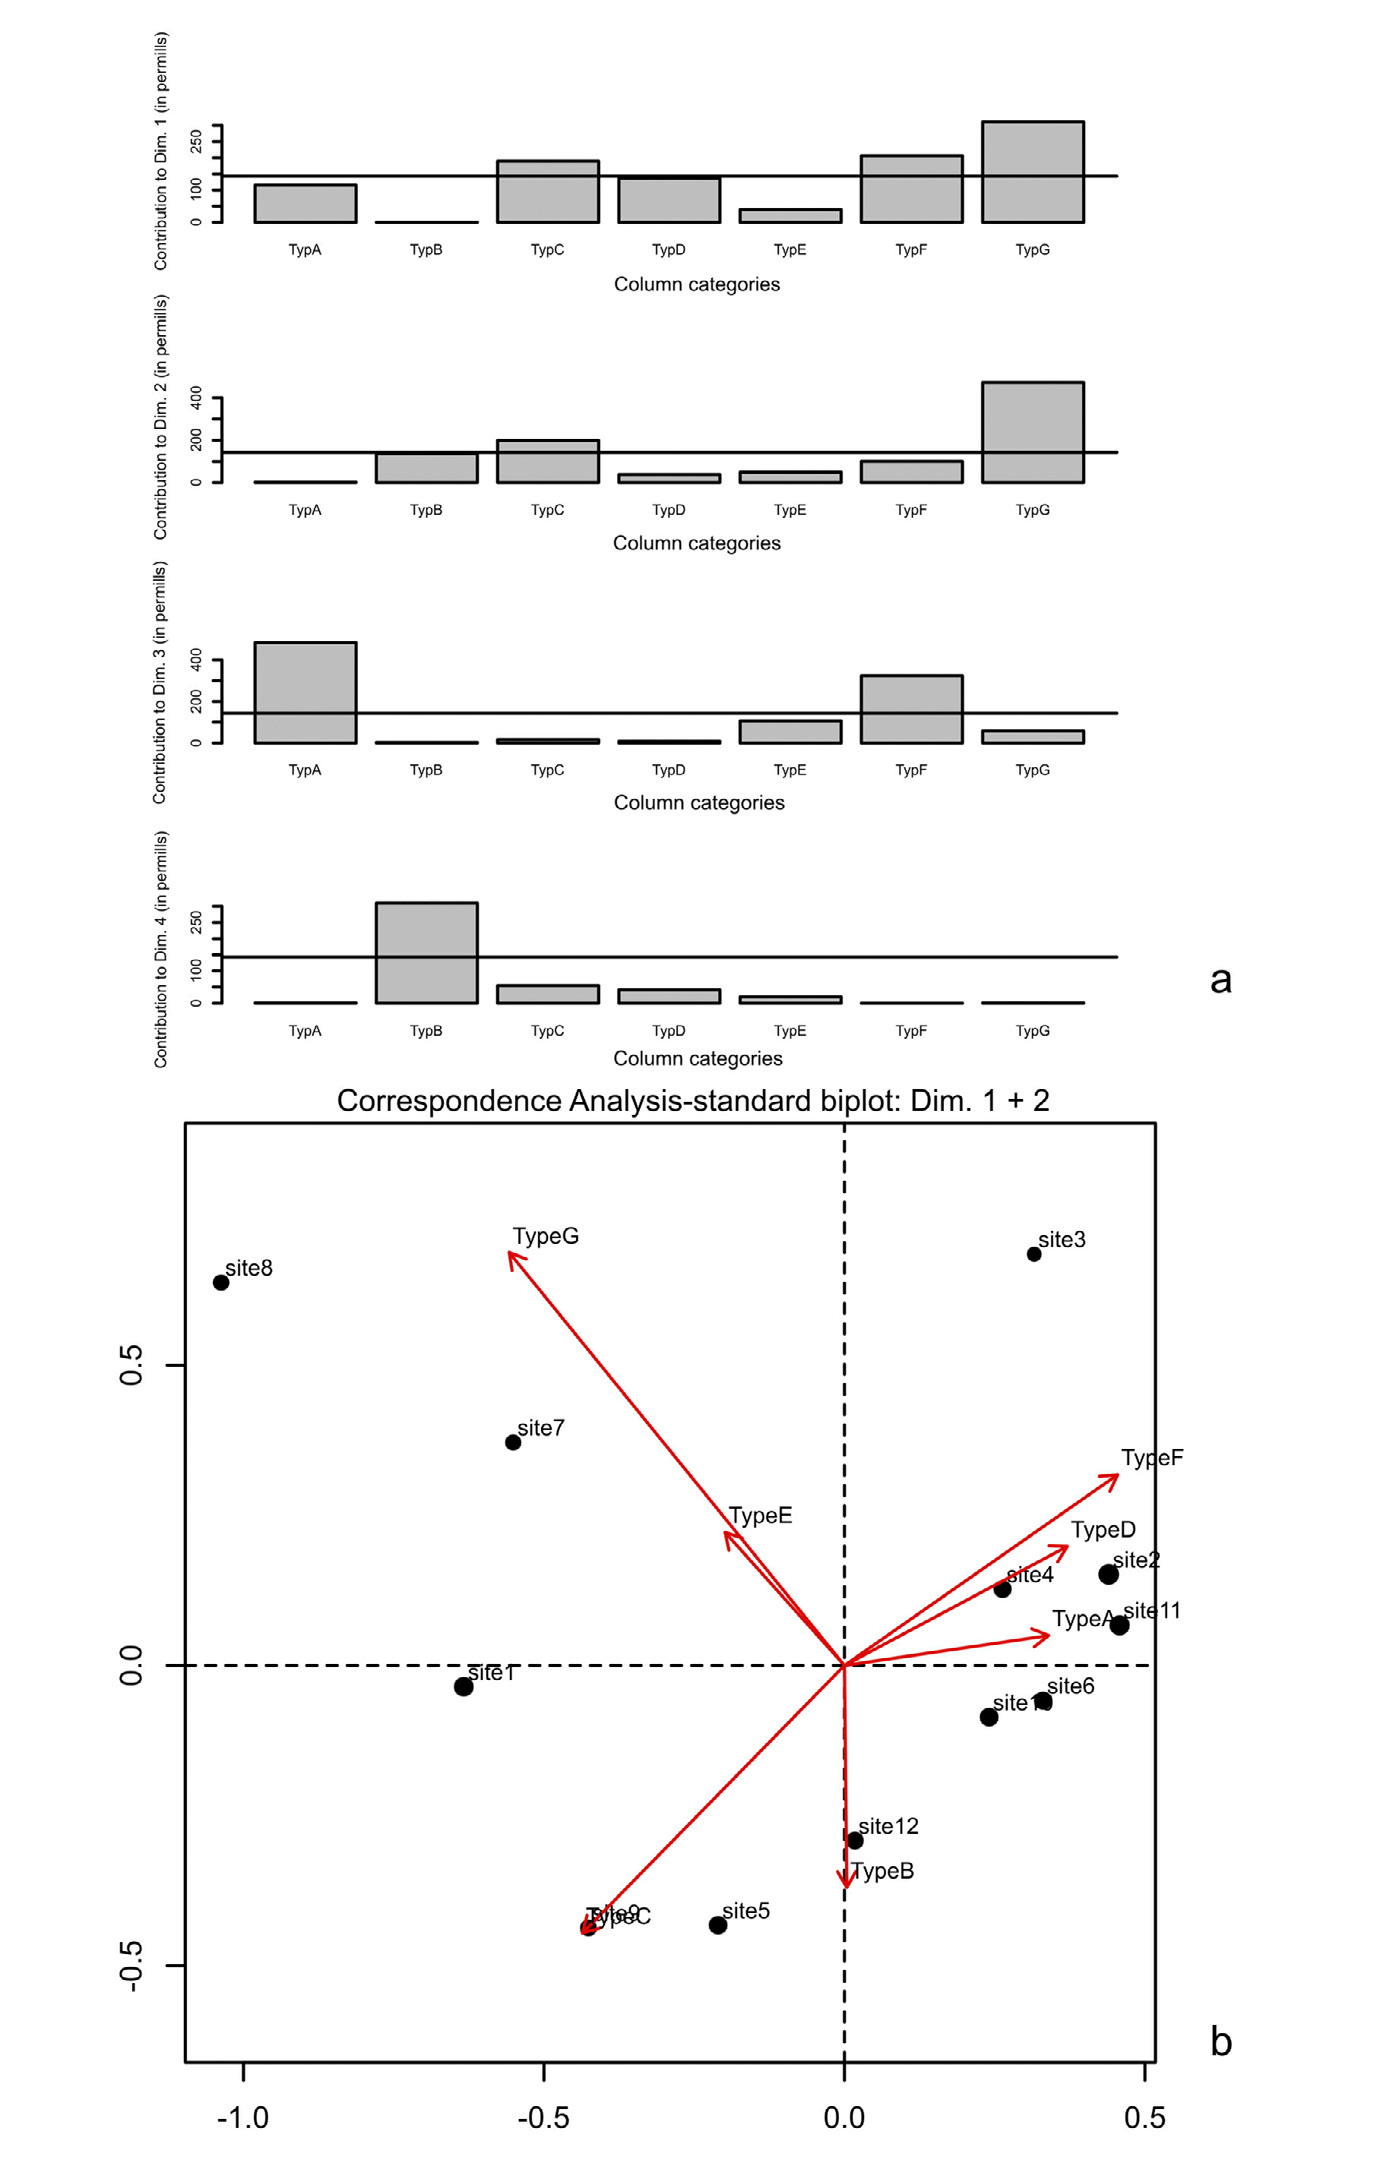
| Caption | CA on data of Tab. 1. Charts provided by the R script: interpretation of the dimensions. a) Bar chart showing the contributions (in permills) of column categories to the first 4 dimensions; a reference line indicates the average contribution. b) Standard Biplot showing the first 2 dimensions (from the “ca” package). Note: the length of each arrow joining the column points to the origin is related to the contribution that each column category makes to the principal axes. |
| Figure number | 2 |
| Article | An R script to facilitate Correspondence Analysis. A guide to the use and the interpretation of results from an archaeological perspective |
| Authors | Alberti G. |
| Volume | Volume 24 |