IADI Image
Metadata
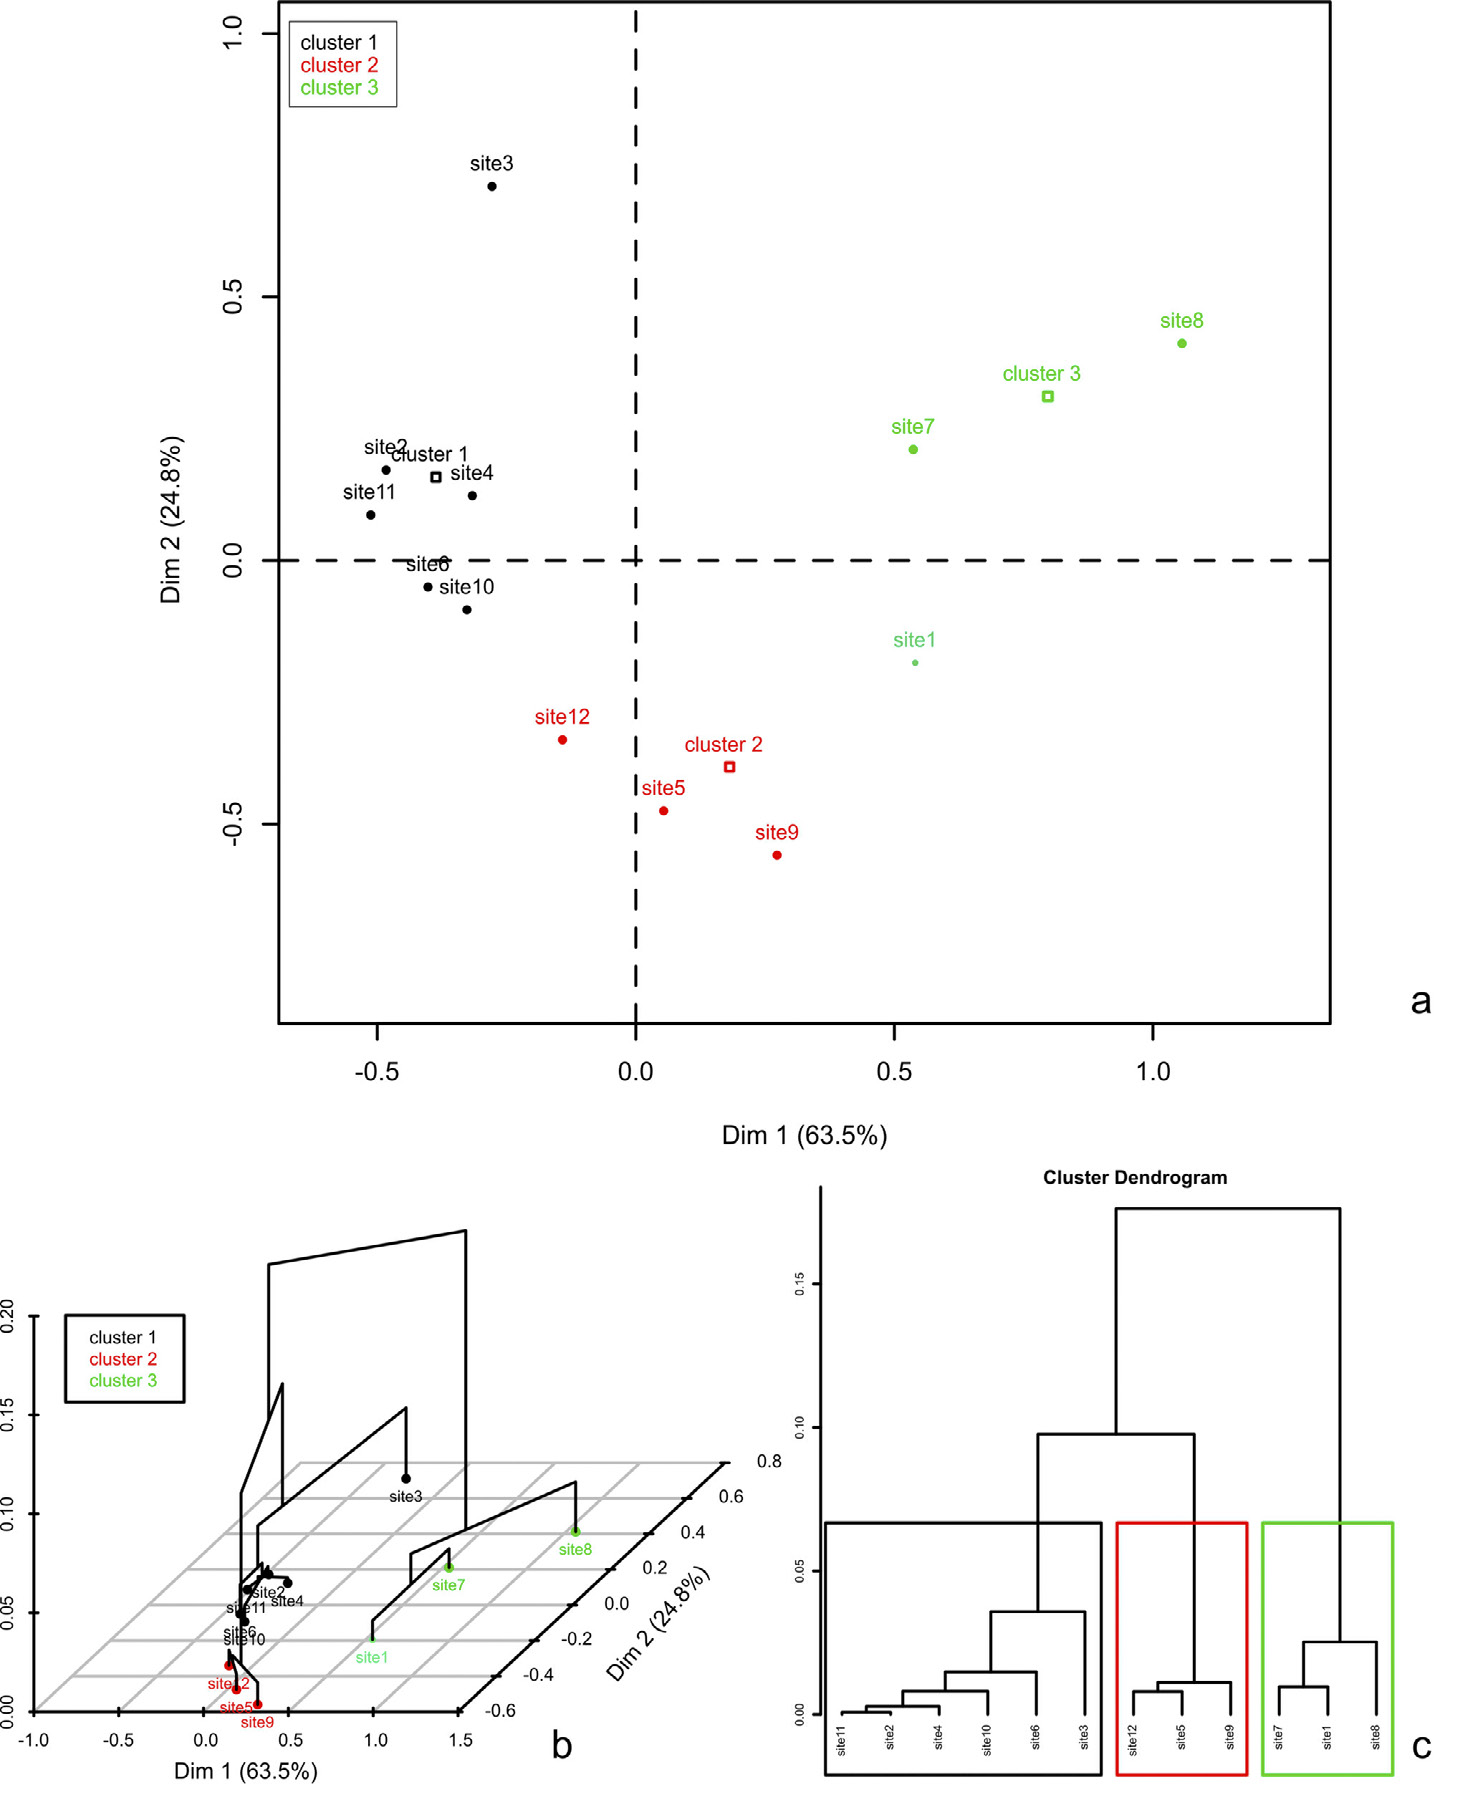
| Caption | CA on data of Tab. 1. Charts provided by the R script. a) CA map showing row categories (sites) with different colours indicating different clusters. b) As previous figure, with cluster tree displayed on the map. c) Cluster tree with optimal cluster partition (boxes) as suggested by “FactoMineR”. All charts from the “FactoMineR” package. |
| Figure number | 5 |
| Article | An R script to facilitate Correspondence Analysis. A guide to the use and the interpretation of results from an archaeological perspective |
| Authors | Alberti G. |
| Volume | Volume 24 |