Volumes / Journal / 15 - 2004 / Orton C.
Click on any image to open slideshow
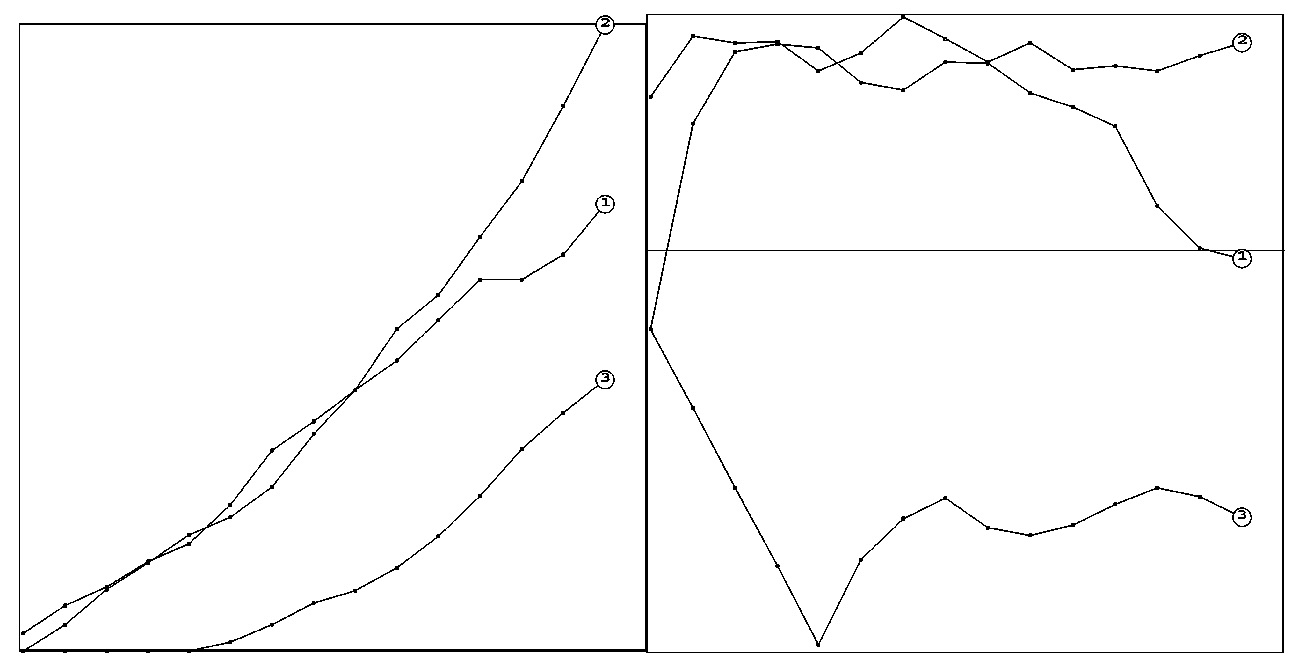
Fig. 1 – (left) Example of a K function: burins in the densezone; (right) The co...
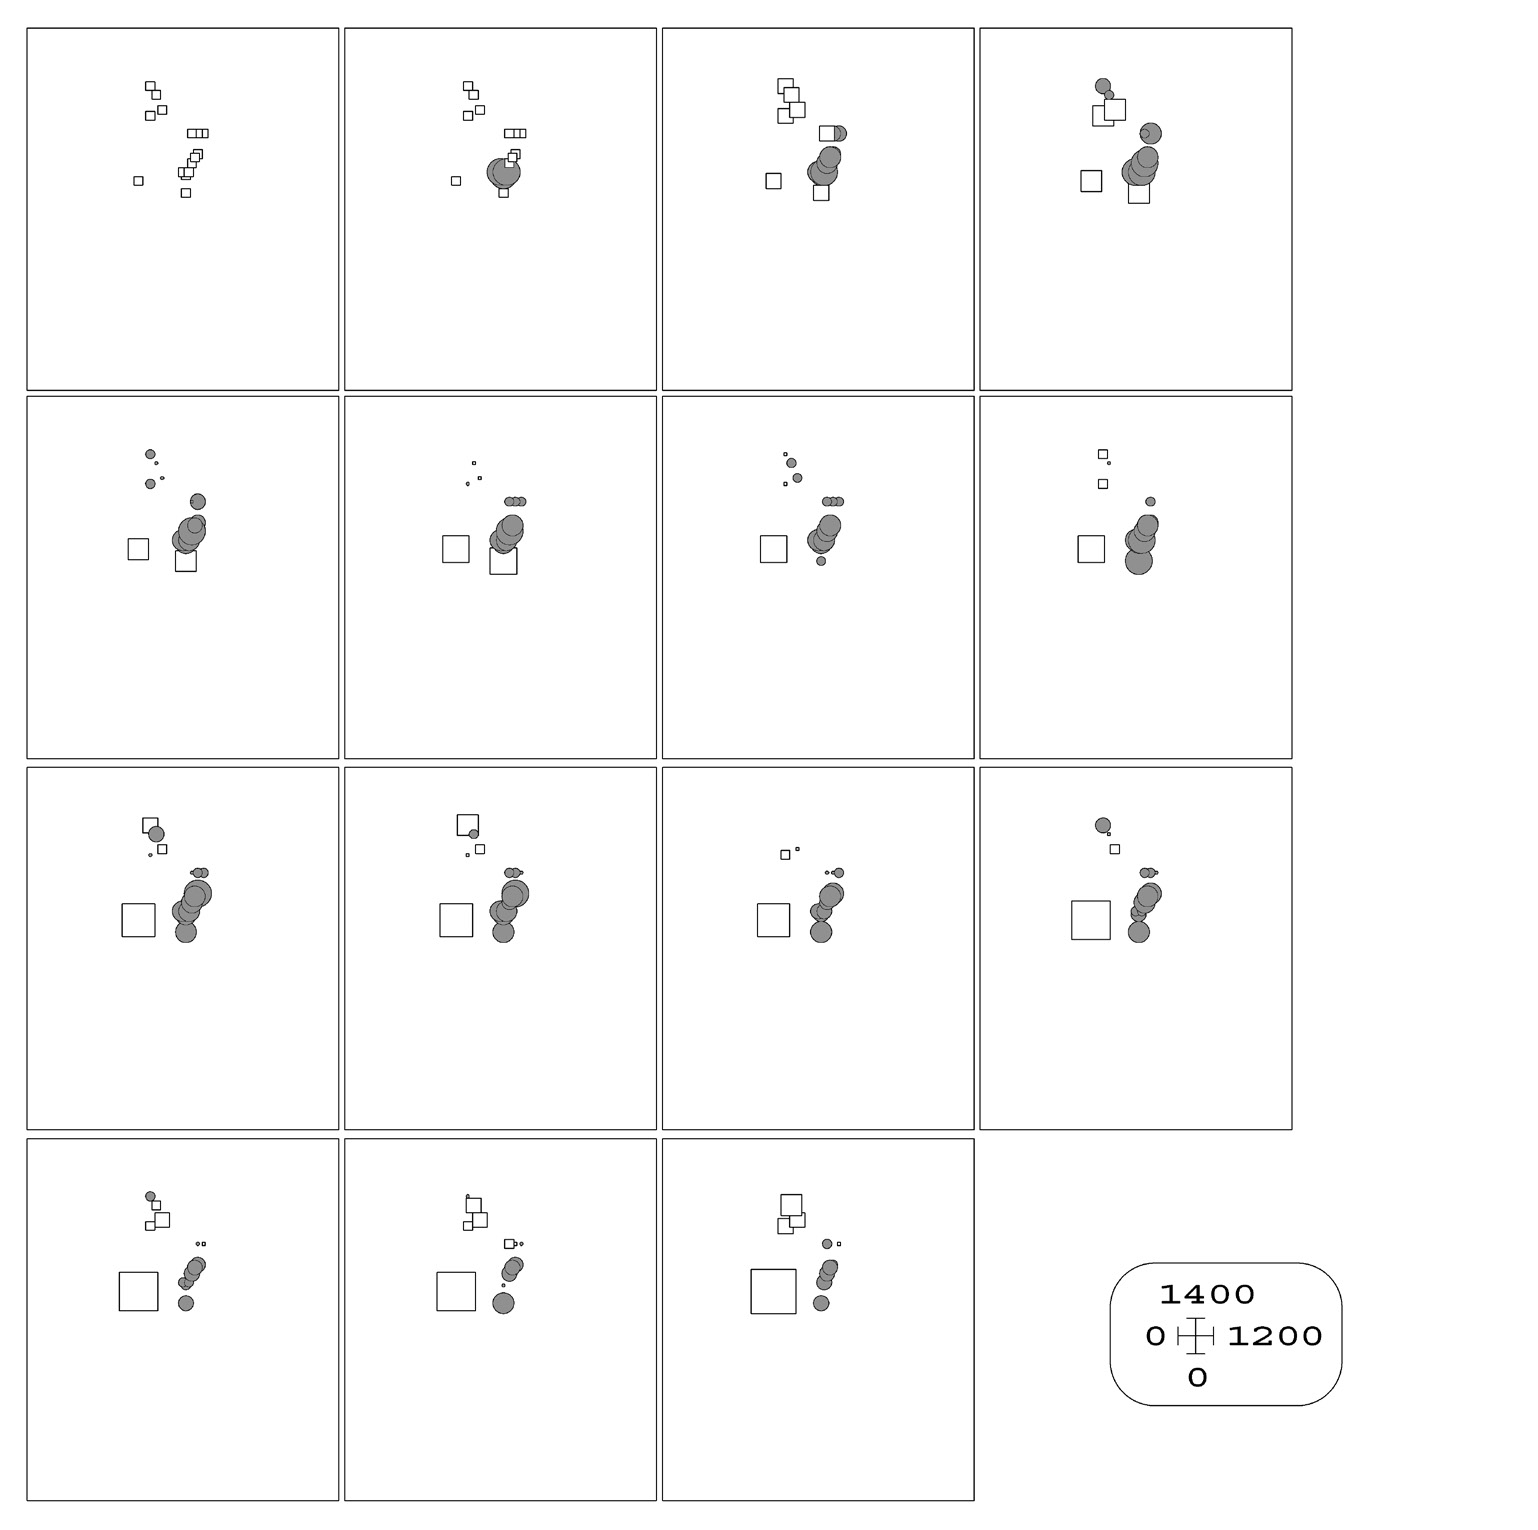
Fig. 2 – The L function map corresponding to Fig. 1. Each symbol represents the ...
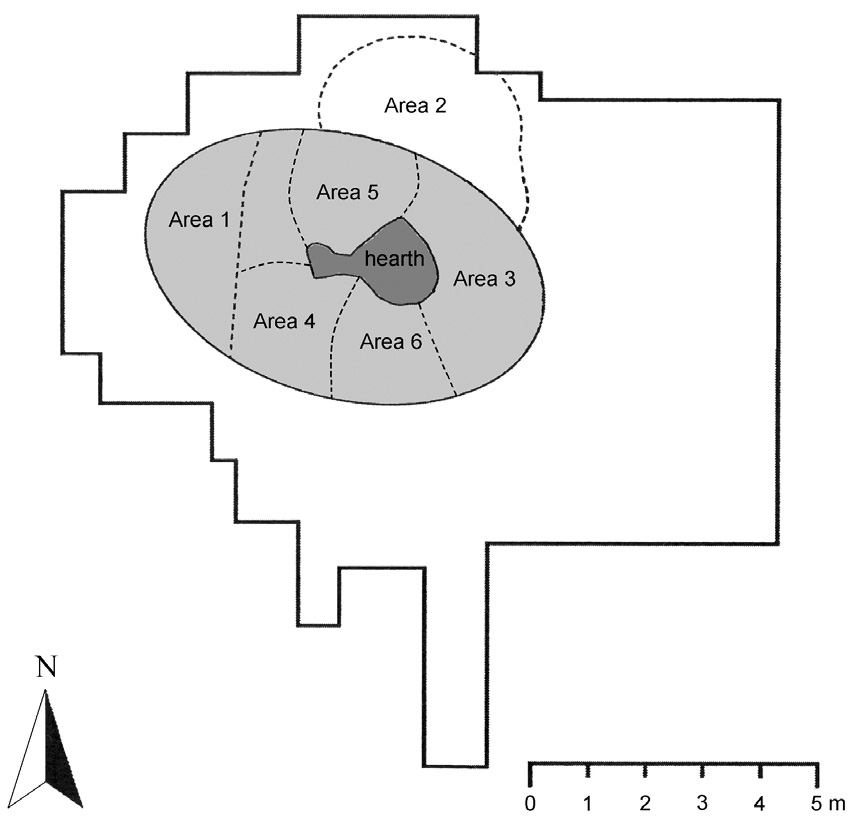
Fig. 3 – Site plan, showing possible zoning of the dense zone and hut floor area...
Orton C. 2004, Point pattern analysis revisited, Archeologia e Calcolatori 15