IADI Image
Metadata
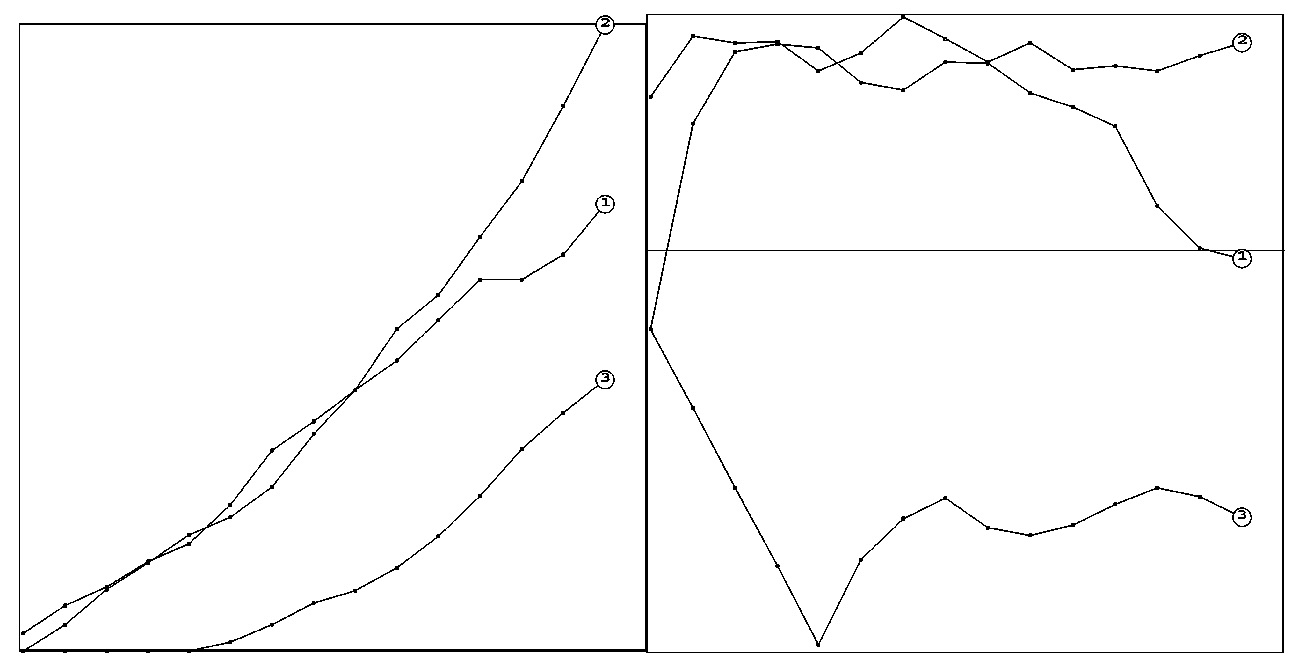
| Caption | (left) Example of a K function: burins in the densezone; (right) The corresponding L function. The horizontal interval are 0,1 m; curve 1 represents the data and curves 2 and 3 delimit a confidence zone for a uniform distribution. Evidence of aggregation can be seen between 0,6 and 0,9 m. |
| Figure number | 1 |
| Article | Point pattern analysis revisited |
| Authors | Orton C. |
| Volume | Volume 15 |