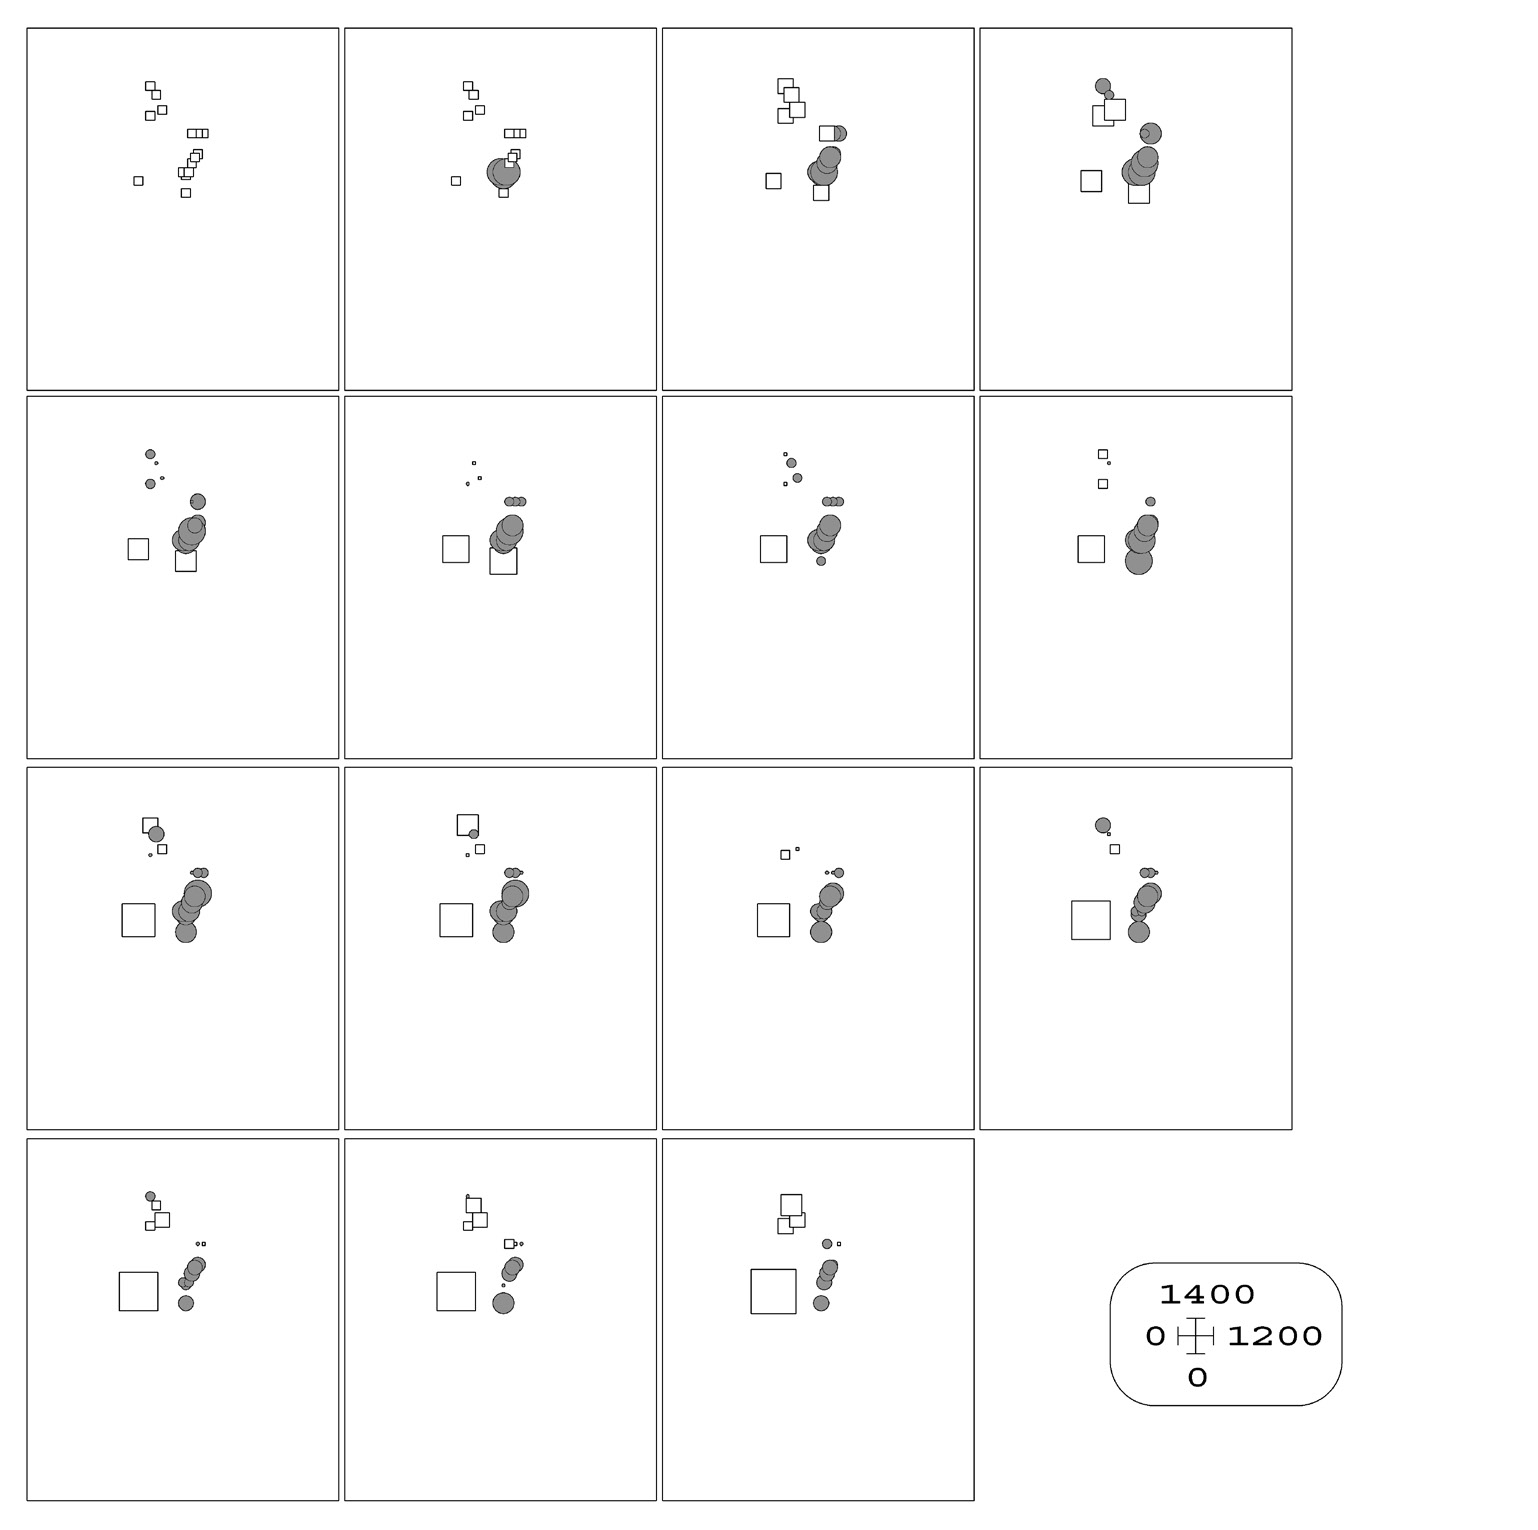
| Caption | The L function map corresponding to Fig. 1. Each symbol represents the location of a burin. Hollow squares indicate “low” L values (i.e. segregation), and shaded circles represent “high” L values (i.e. aggregation). The size of the symbol reflects the strength of the pattern. The “thumbnail” maps are at 0,1 m intervals of h, from h = 0,1 m (top left) to h = 1,5 m (bottom right). Strong aggregation can be seen between h = 0,6 and h = 0,9 m, but even here some burins (to the west) are segregated. |