Volumes / Journal / 21 - 2010 / Baxter M., Cool H., Anderson M.
Click on any image to open slideshow
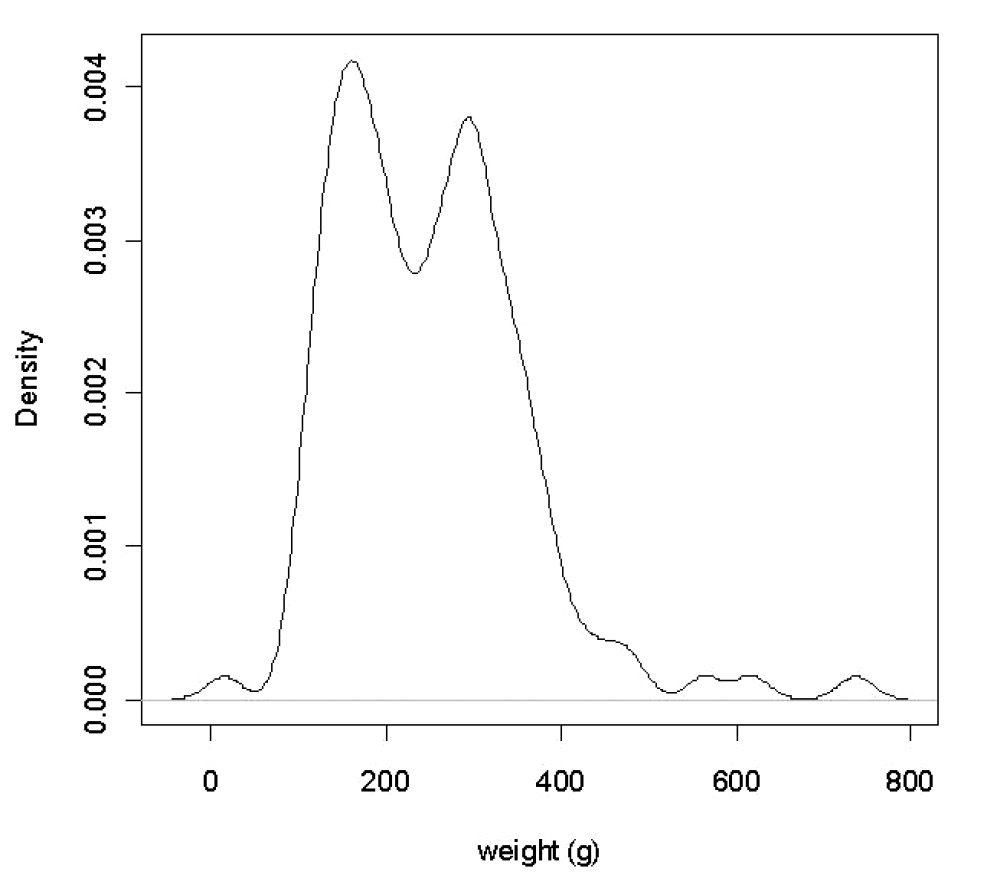
Fig. 1 – A KDE using all the weight data; the main modes are at 162 g and 293 g....
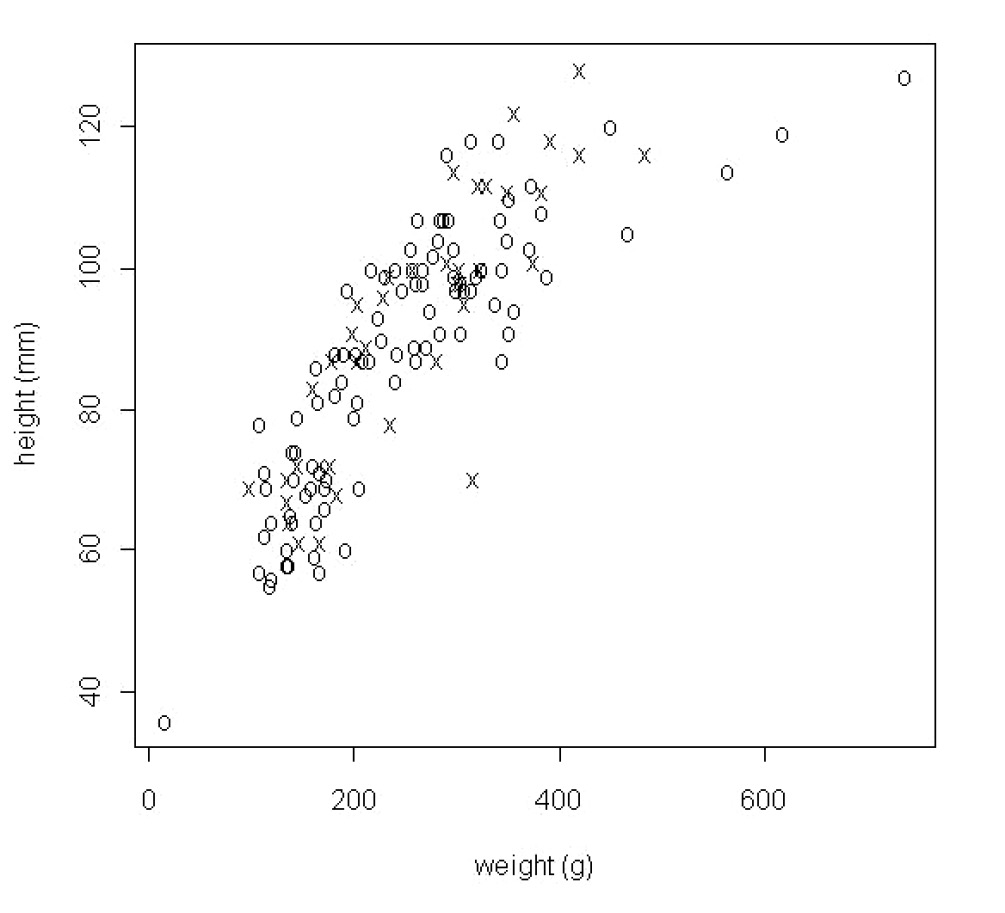
Fig. 2 – Height against weight labelled by “old” (o) or “new” (x).
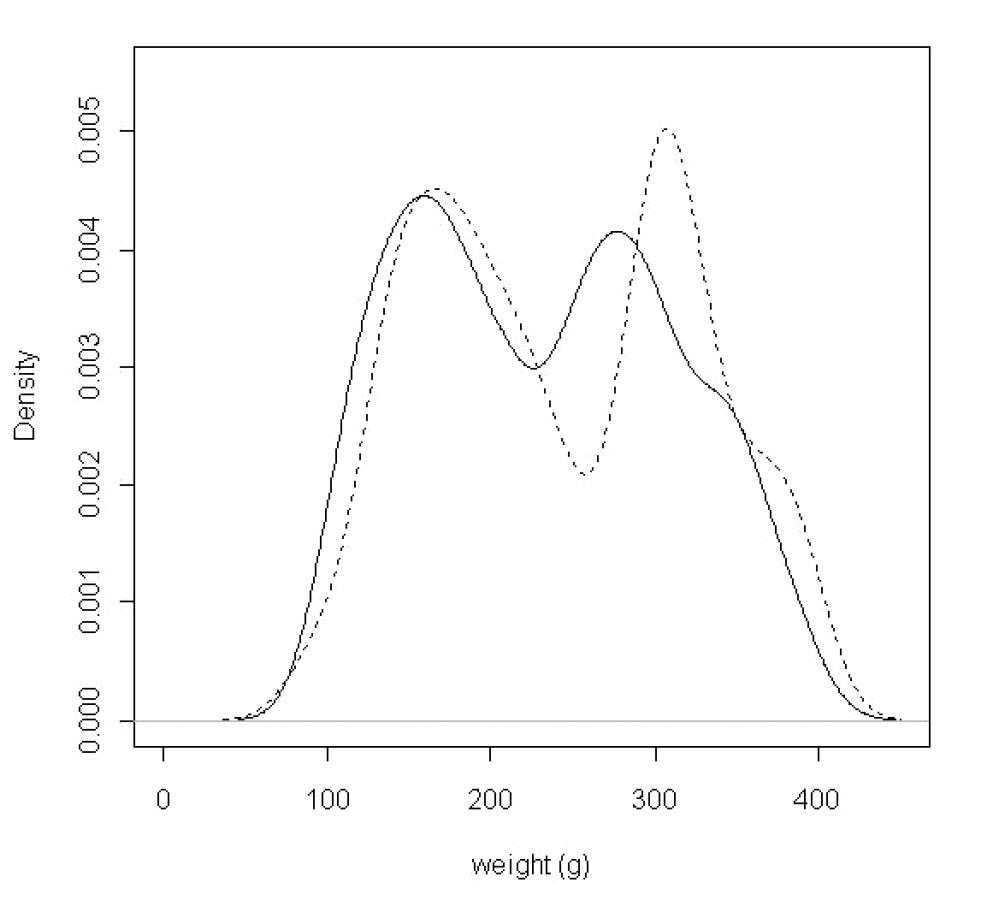
Fig. 3 – KDEs for the “old” (solid line) and “new” data (dashed line) for weight...
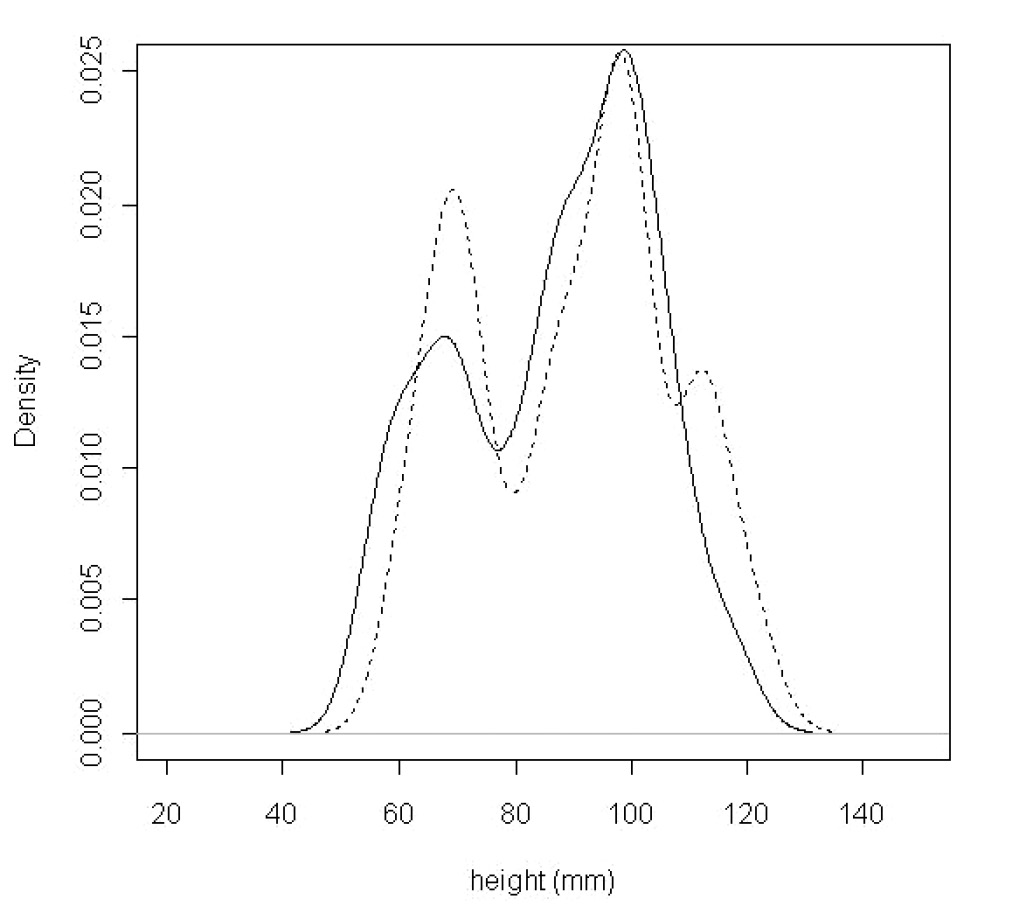
Fig. 4 – As Fig. 3, but for height. The modes are at 68 and 98 for the “old” and...
Fig. 5 – KDE for the volume data, using a subjectively determined bandwidth of 8...
Fig. 6 – A bivariate contour plot based on a two-dimensional kernel density esti...
Fig. 7 – Plot of estimated volume against height. The solid line is the regressi...
Fig. 8 – A plot of the maximum to minimum ratio of the tops of the loomweights a...
Baxter M., Cool H., Anderson M. 2010, Statistical analysis of some loomweights from Pompeii: a postscript, Archeologia e Calcolatori 21