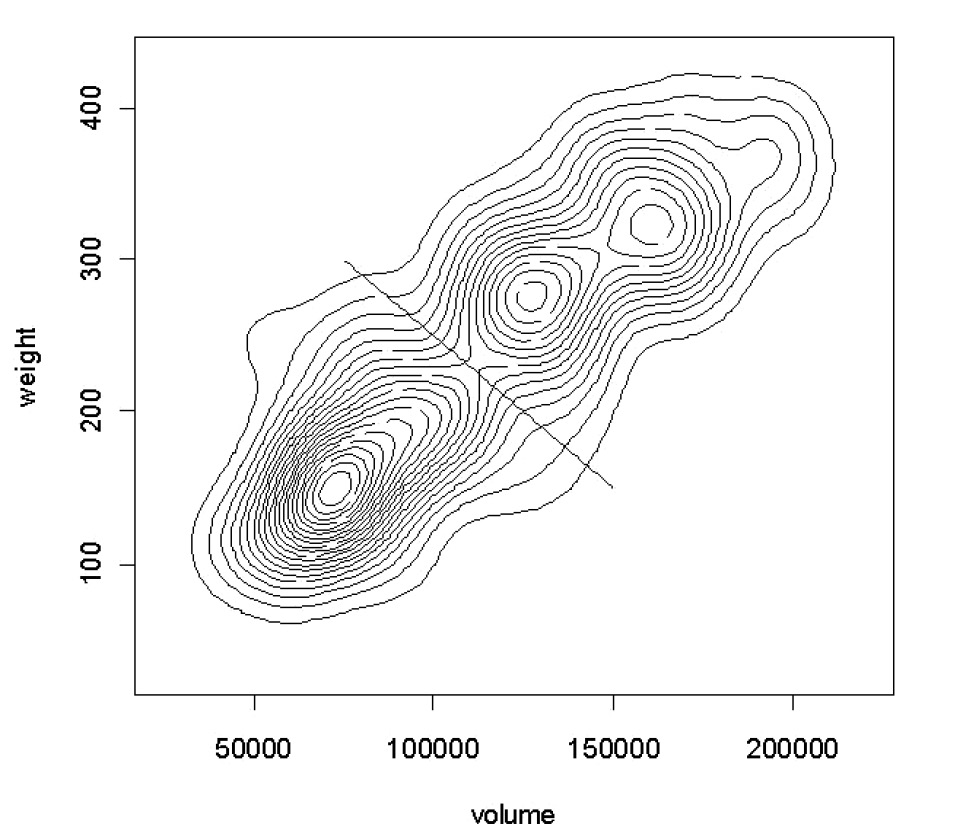
| Caption | A bivariate contour plot based on a two-dimensional kernel density estimate for the volume and weight data. The kde2 function from the MASS library in R was used, with bandwidths of 40000 and 100 suggested by the Sheather-Jones estimates for each variable separately. The dotted line shows the division into large and small suggested by Fig. 7. |
| Figure number | 6 |
| Article | Statistical analysis of some loomweights
from Pompeii: a postscript |
| Authors | Baxter M., Cool H., Anderson M. |
| Volume |
Volume 21
|
| Pleiades places |
https://pleiades.stoa.org/places/433032 |
| Subjects |
| methodologies and technologies |
| data |
| graphic document genres |
| diagrams |