Volumes / Journal / 21 - 2010 / Baxter M., Cool H.
Click on any image to open slideshow
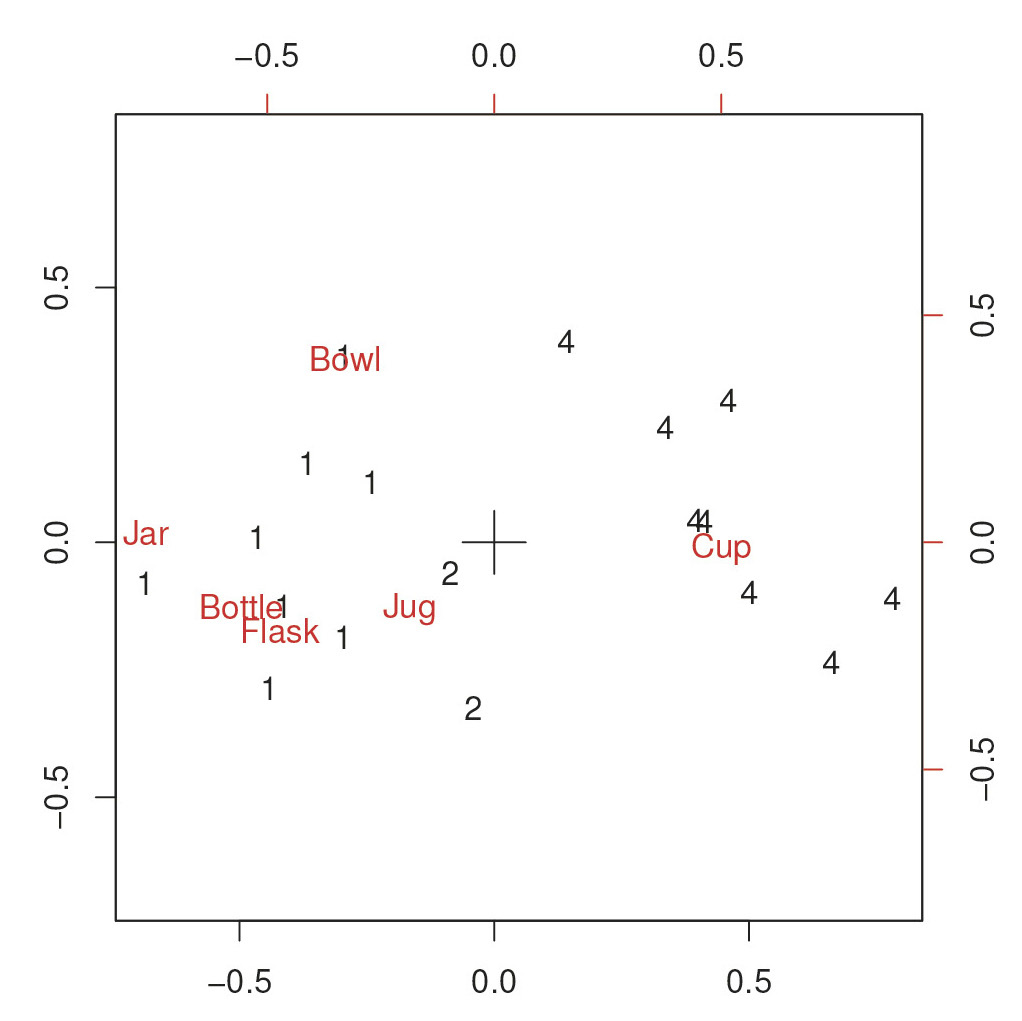
Fig. 1 – Correspondence Analysis of Table 1 – superimposed row and column plot. ...
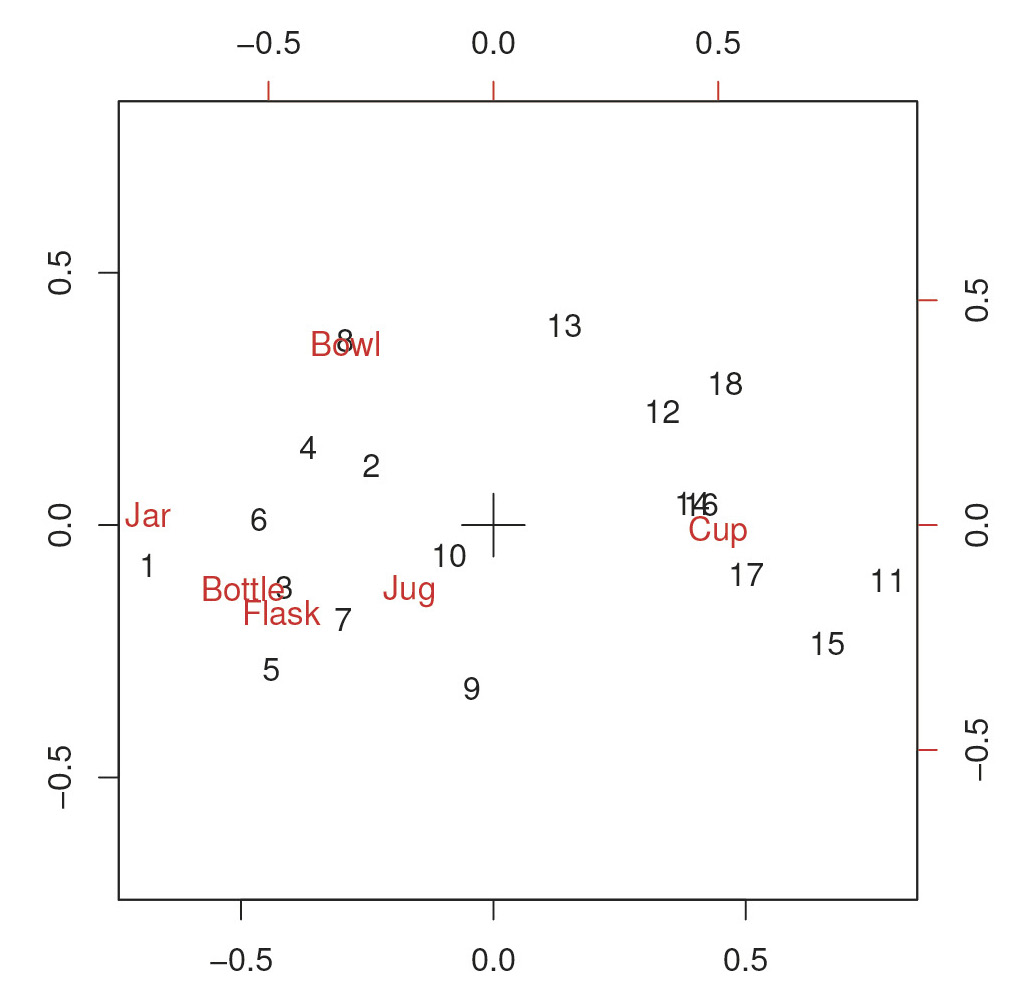
Fig. 2 – Correspondence Analysis of Table 1 – superimposed row and column plot; ...
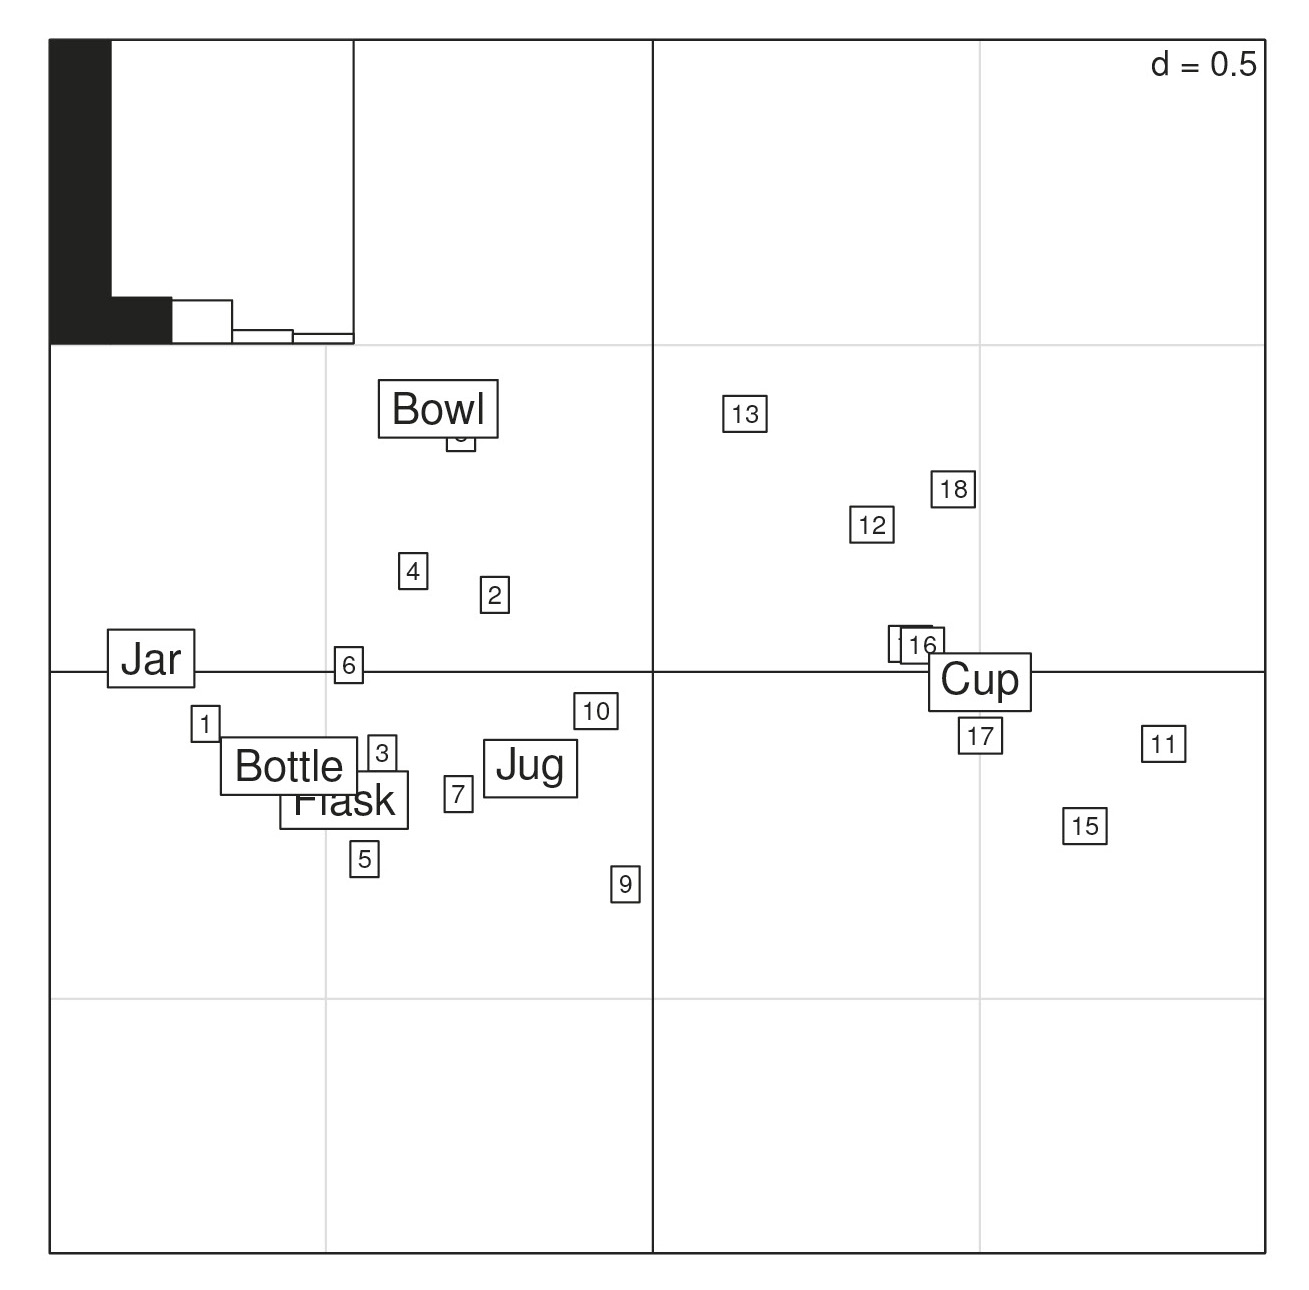
Fig. 3 – Correspondence Analysis of Table 1 – separate row and column plots. The...
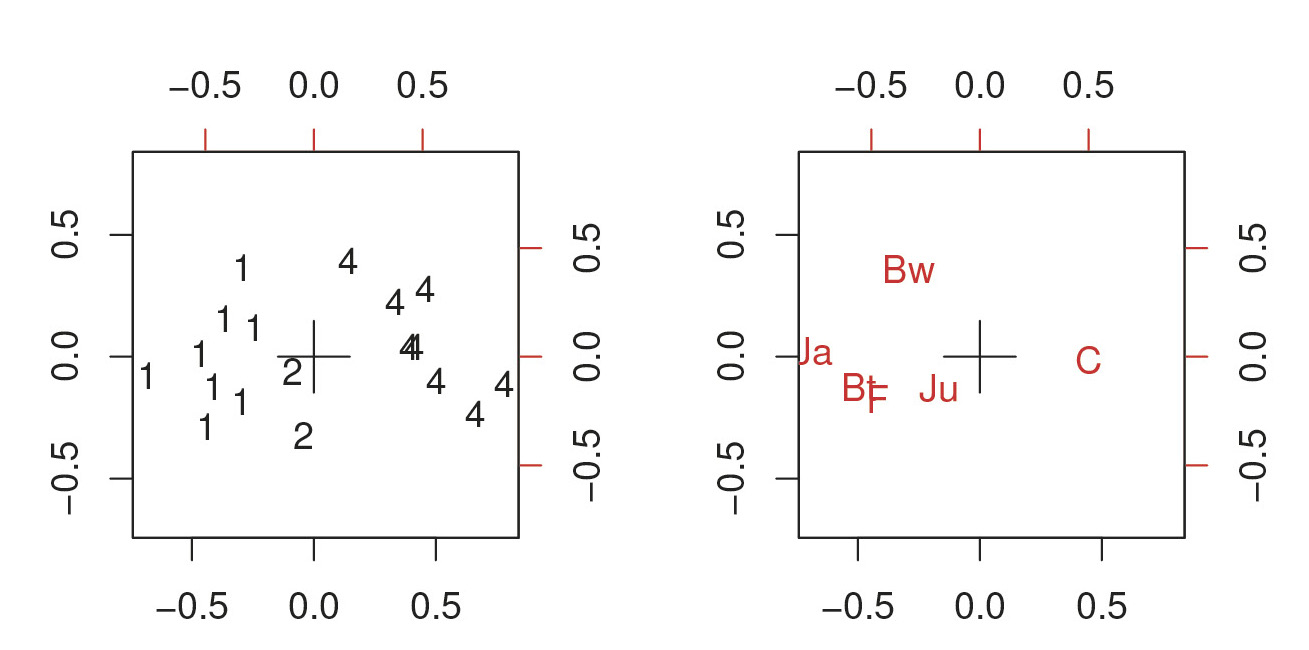
Fig. 4 – As Fig. 1, using the dudi.coa function from the ade4 package.
Fig. 5 – Row plot for Table 1, labelled by date, using the dudi.coa function fro...
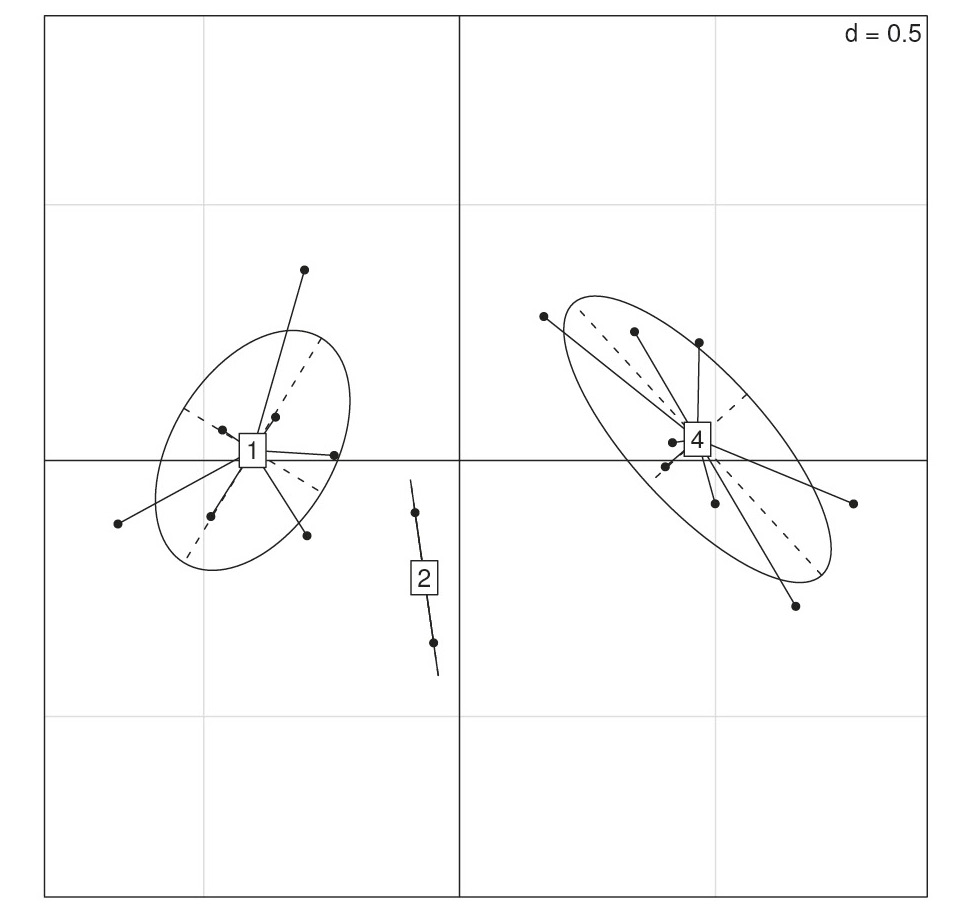
Fig. 6 – An alternative presentation to Fig. 5, associating ellipses with differ...
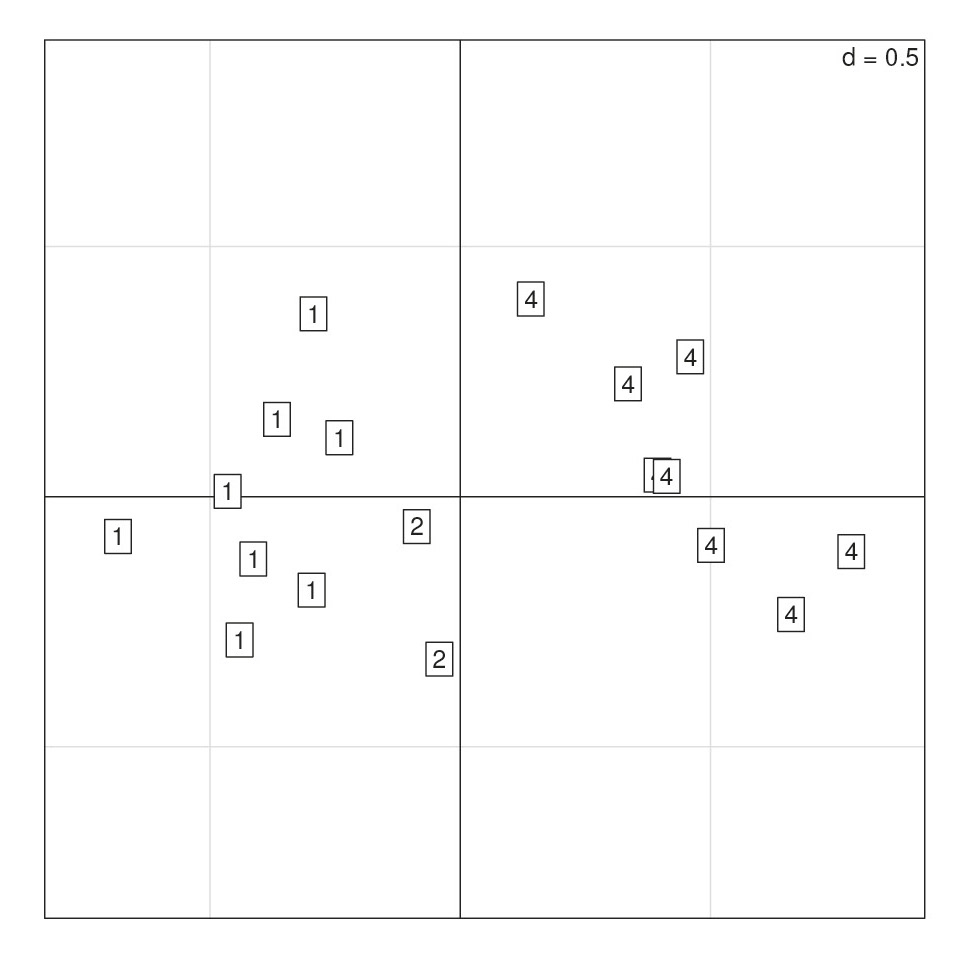
Fig. 7 – Correspondence Analysis of Table 2 – row plot onl. The corresp function...
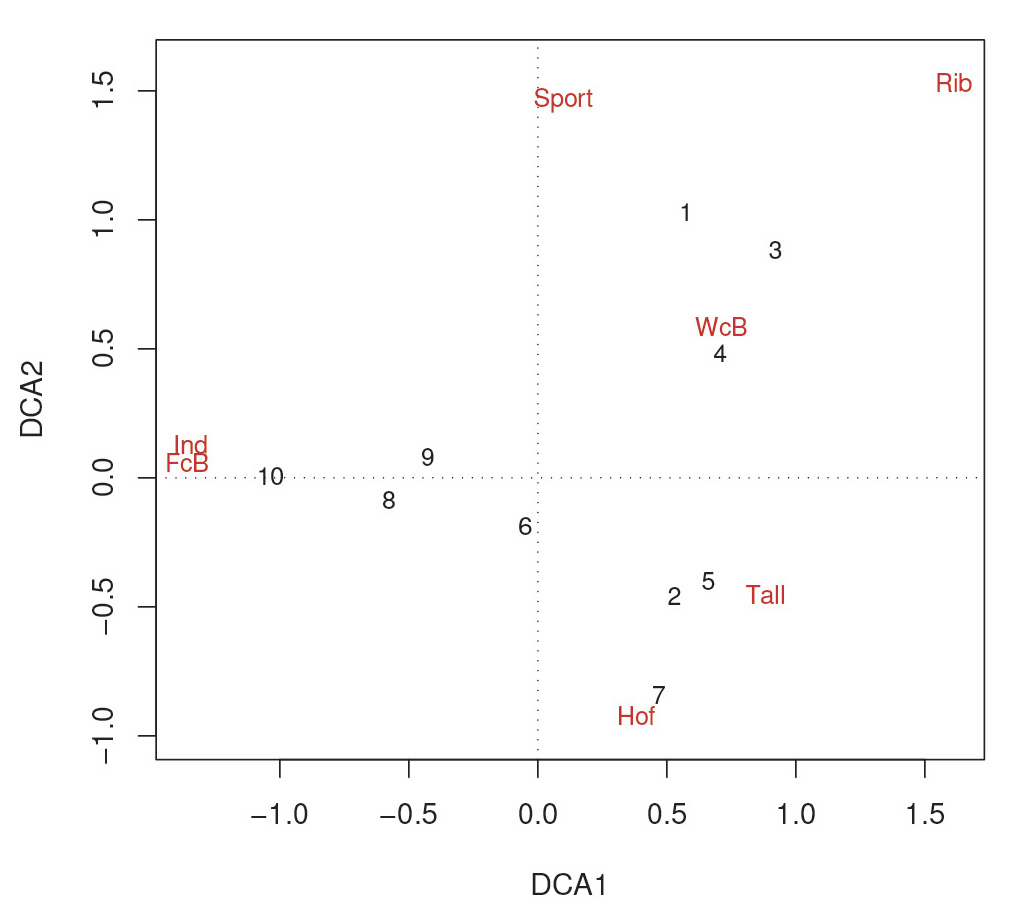
Fig. 8 – A Detrended Correspondence Analysis for the data of Table 2, obtained u...
Baxter M., Cool H. 2010, Correspondence Analysis in R for archaeologists: an educational account, Archeologia e Calcolatori 21