IADI Image
Metadata
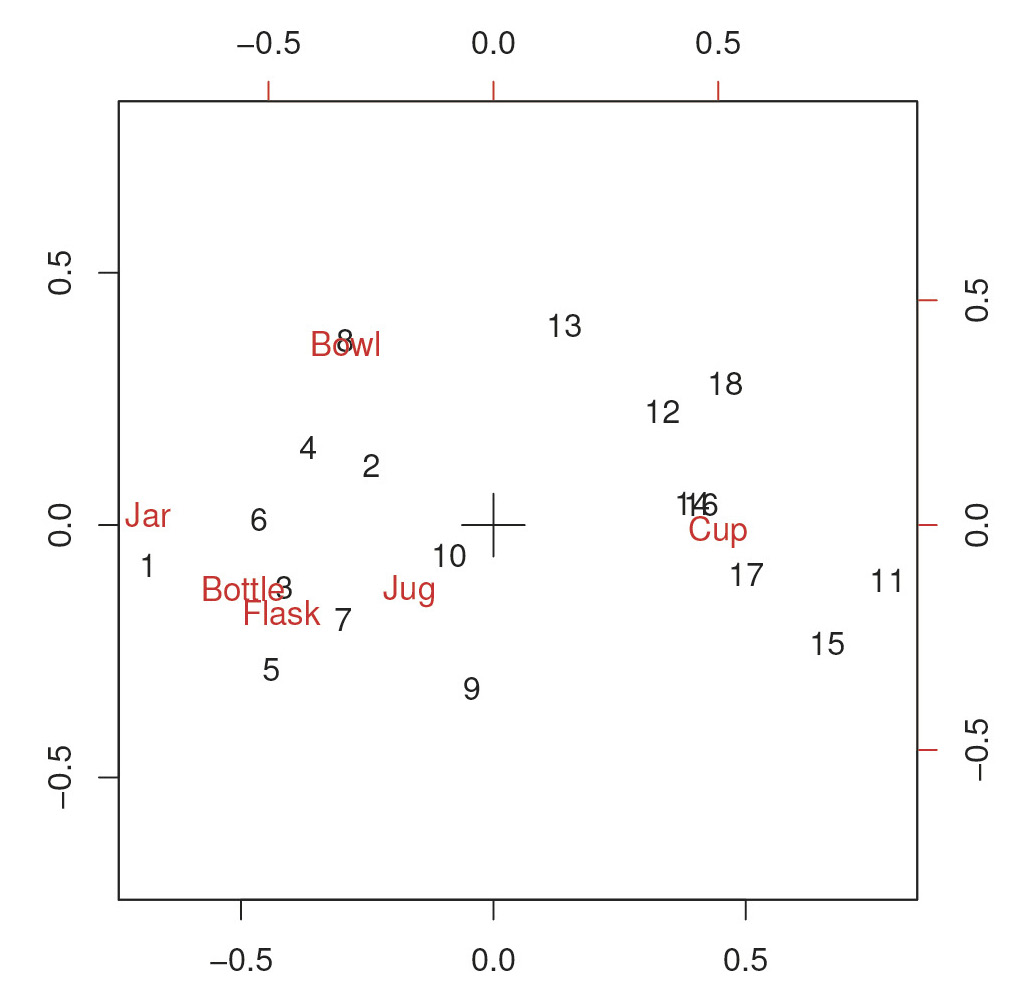
| Caption | Correspondence Analysis of Table 1 – superimposed row and column plot; rows labelled by date (1 = 1st/2nd century AD; 2 = 2nd/3rd century; 4 = 4th century). The corresp function from the MASS package was used. |
| Figure number | 2 |
| Article | Correspondence Analysis in R for archaeologists: an educational account |
| Authors | Baxter M., Cool H. |
| Volume | Volume 21 |