Volumes / Supplements / 6 - 2014 / Celani S.
Click on any image to open slideshow
Fig. 1 – Distribution of support types.
Fig. 2 – Distribution of writing instrument types compared to distribution of su...
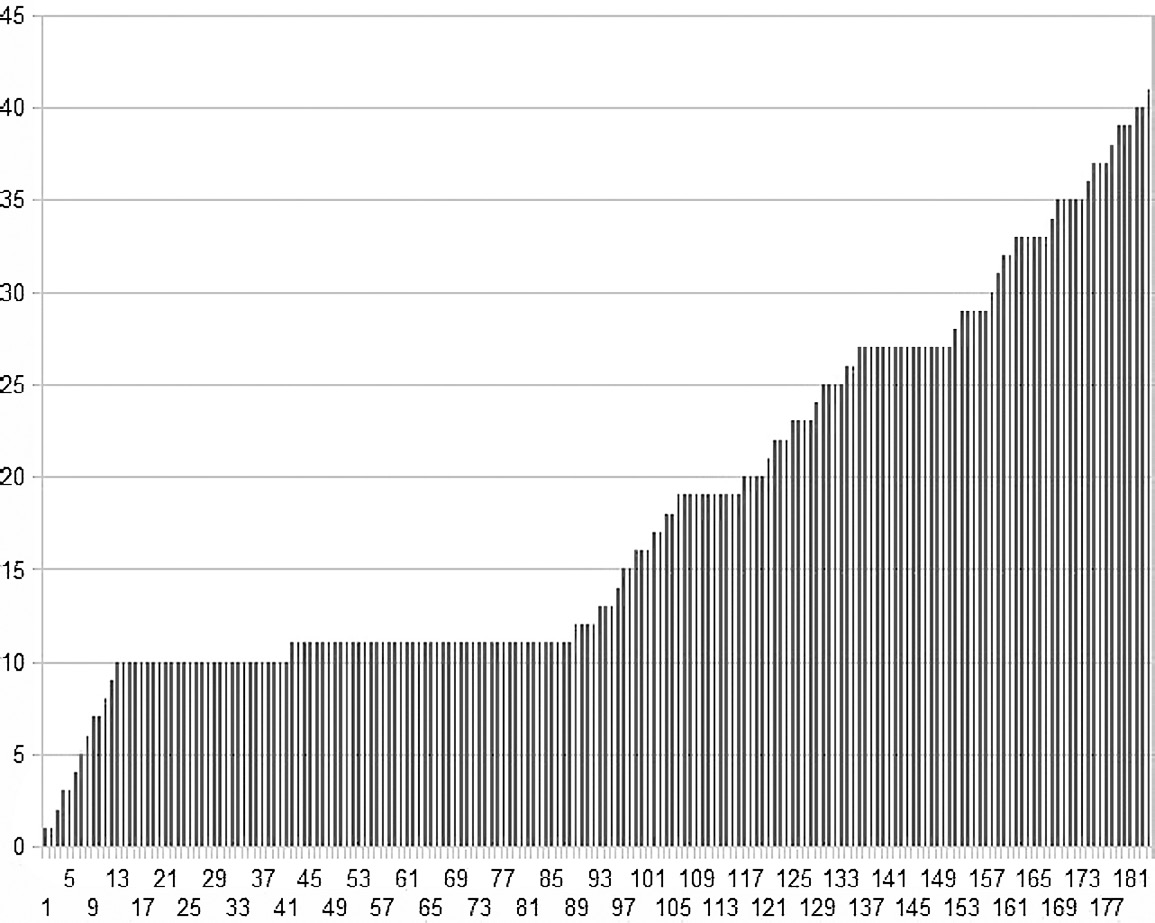
Fig. 3 – LC graph.
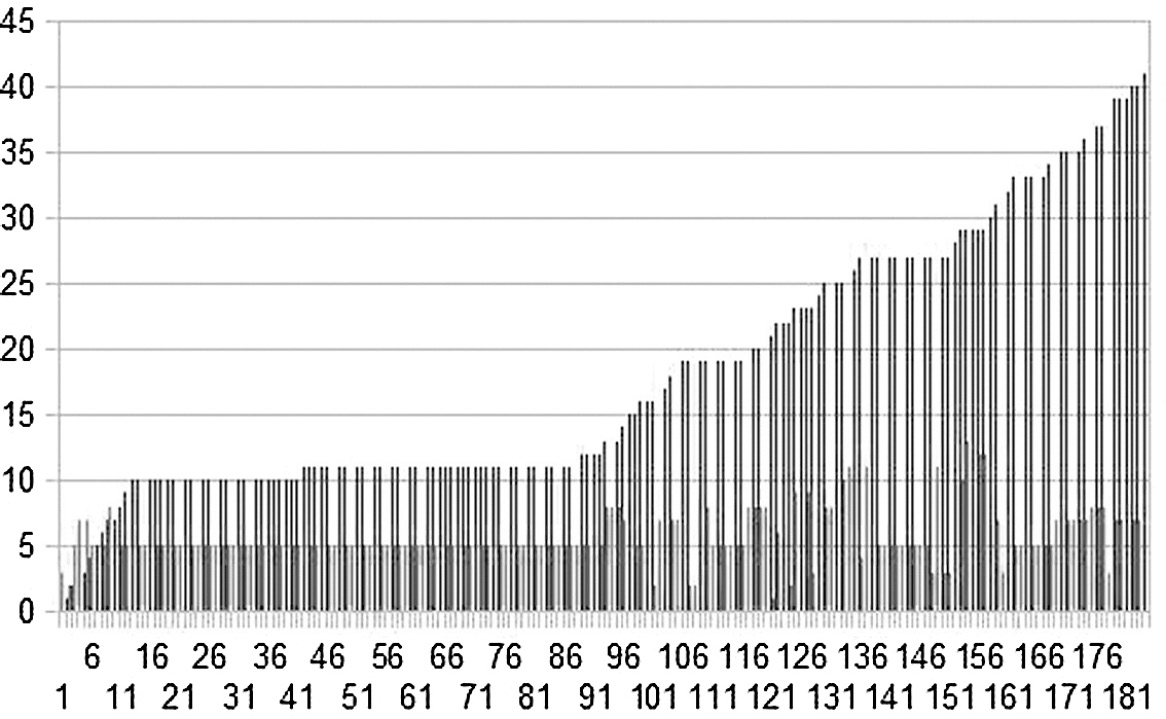
Fig. 4 – PP graph.
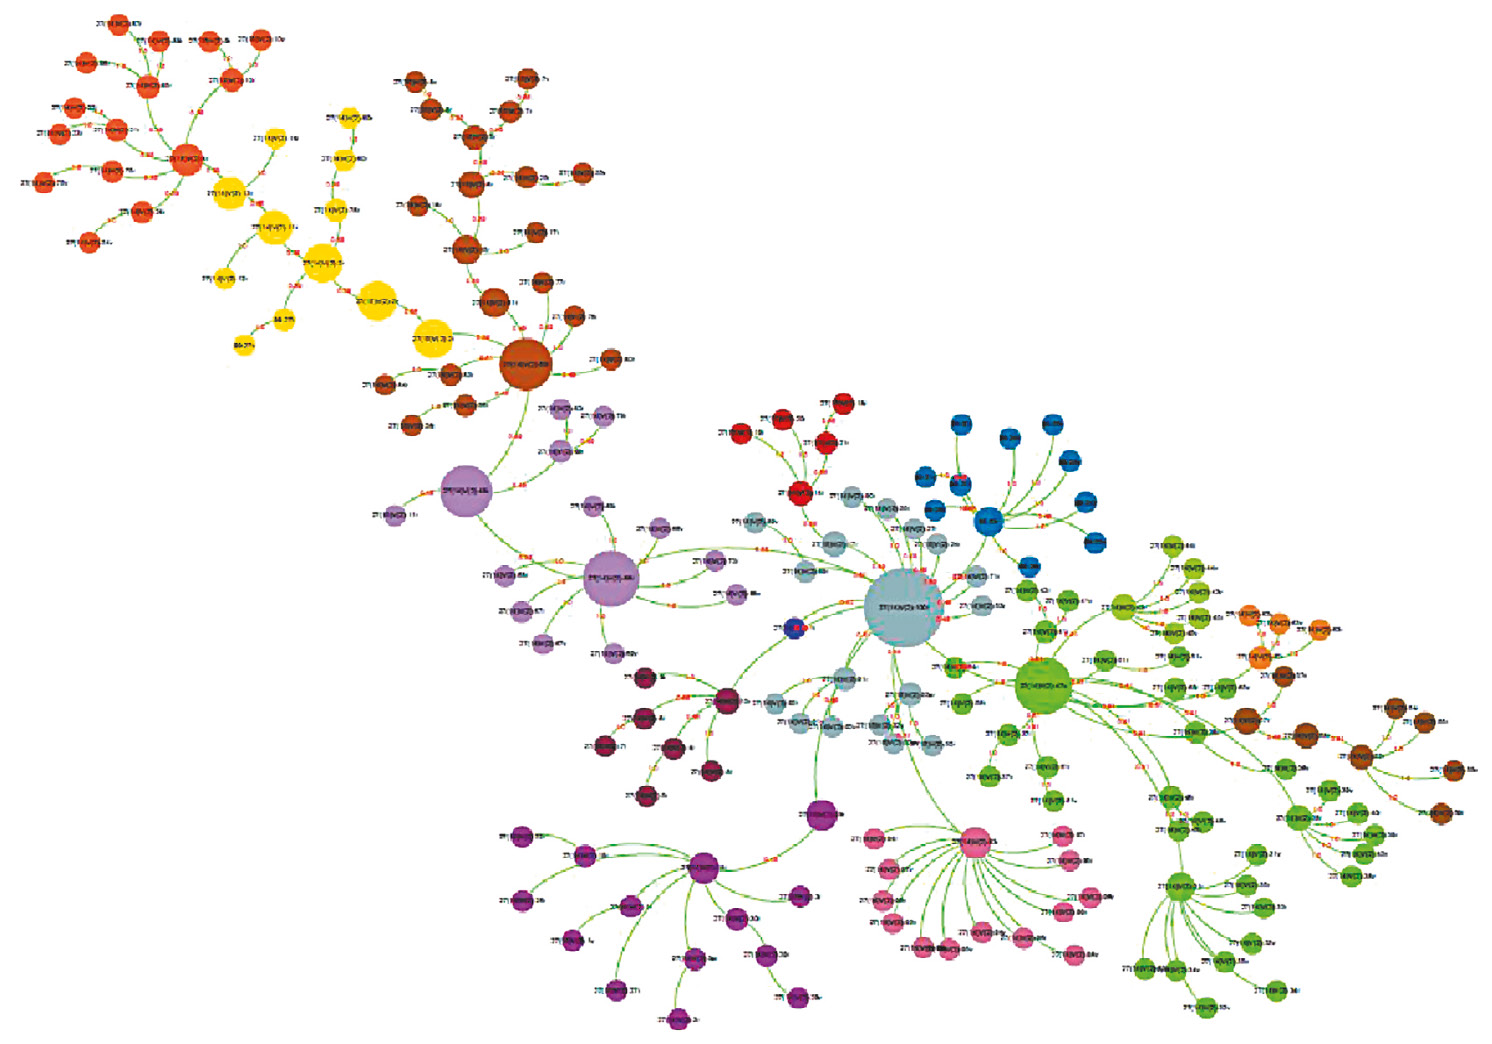
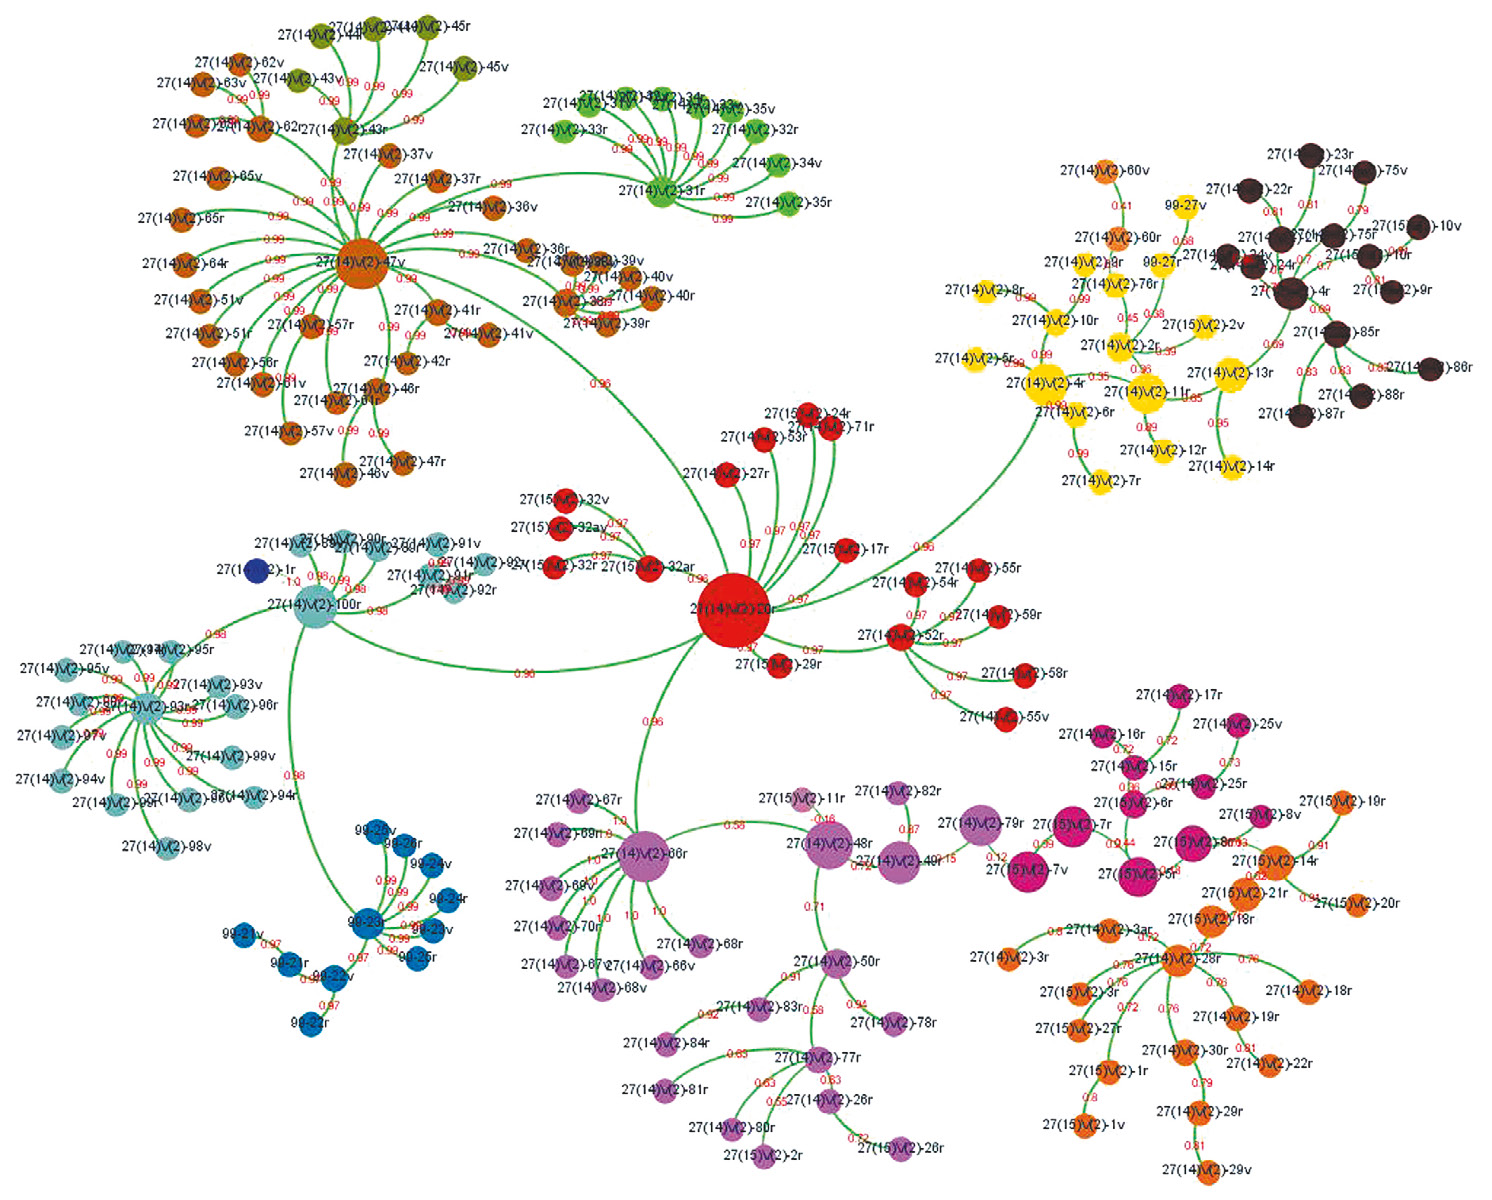
Fig. 5 – Auto-CM graph.
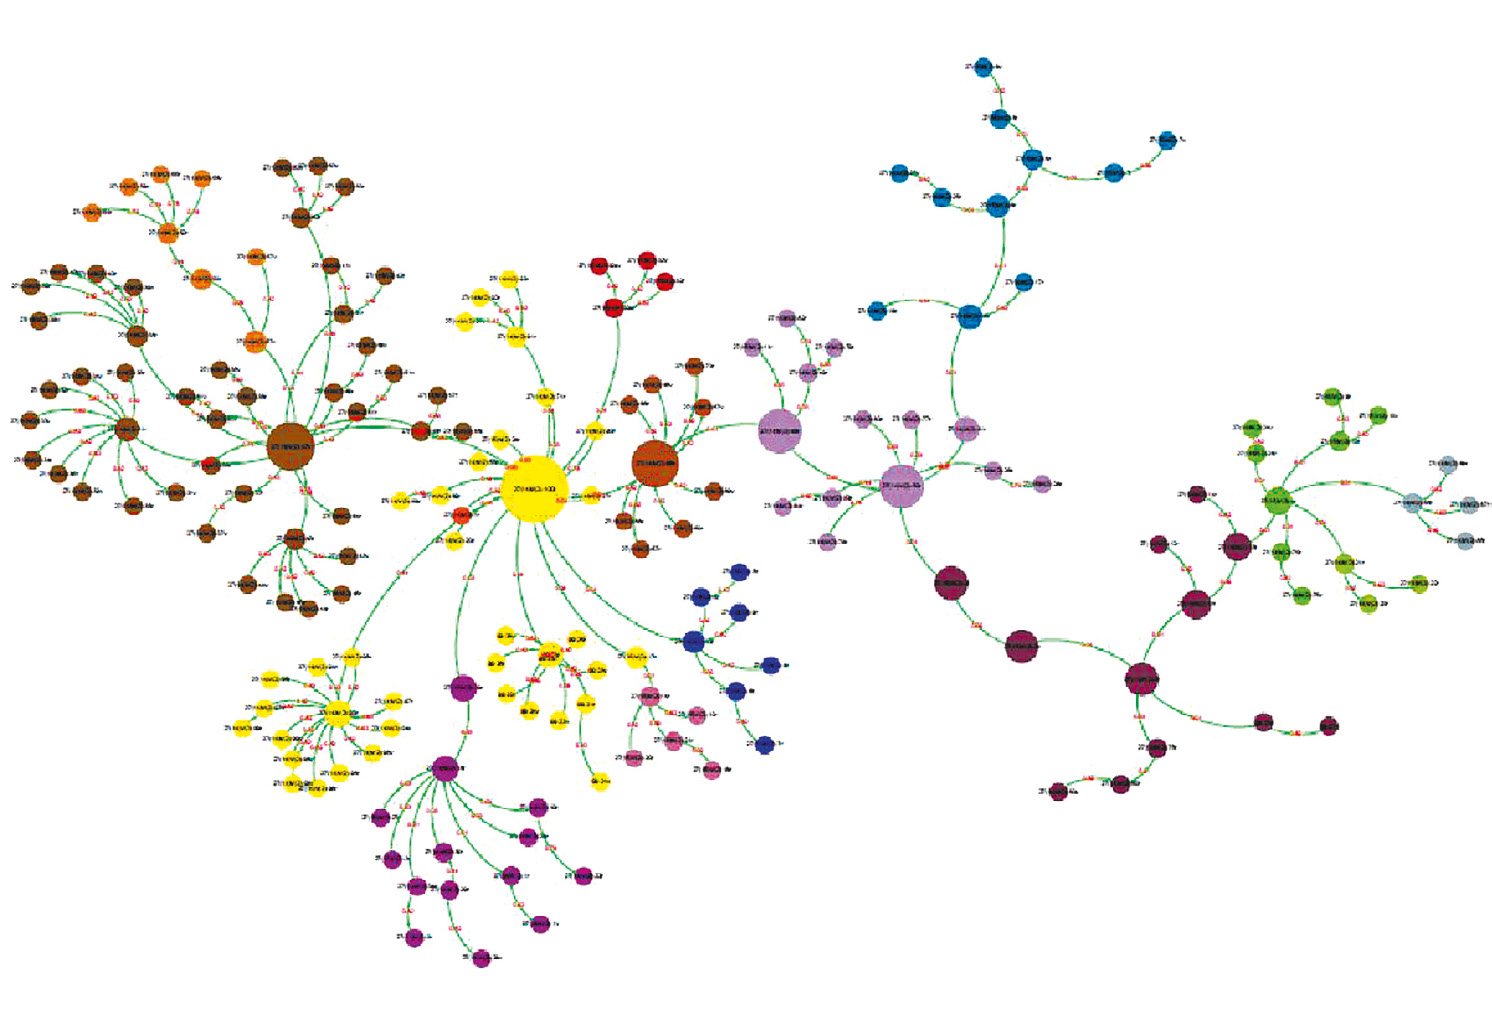
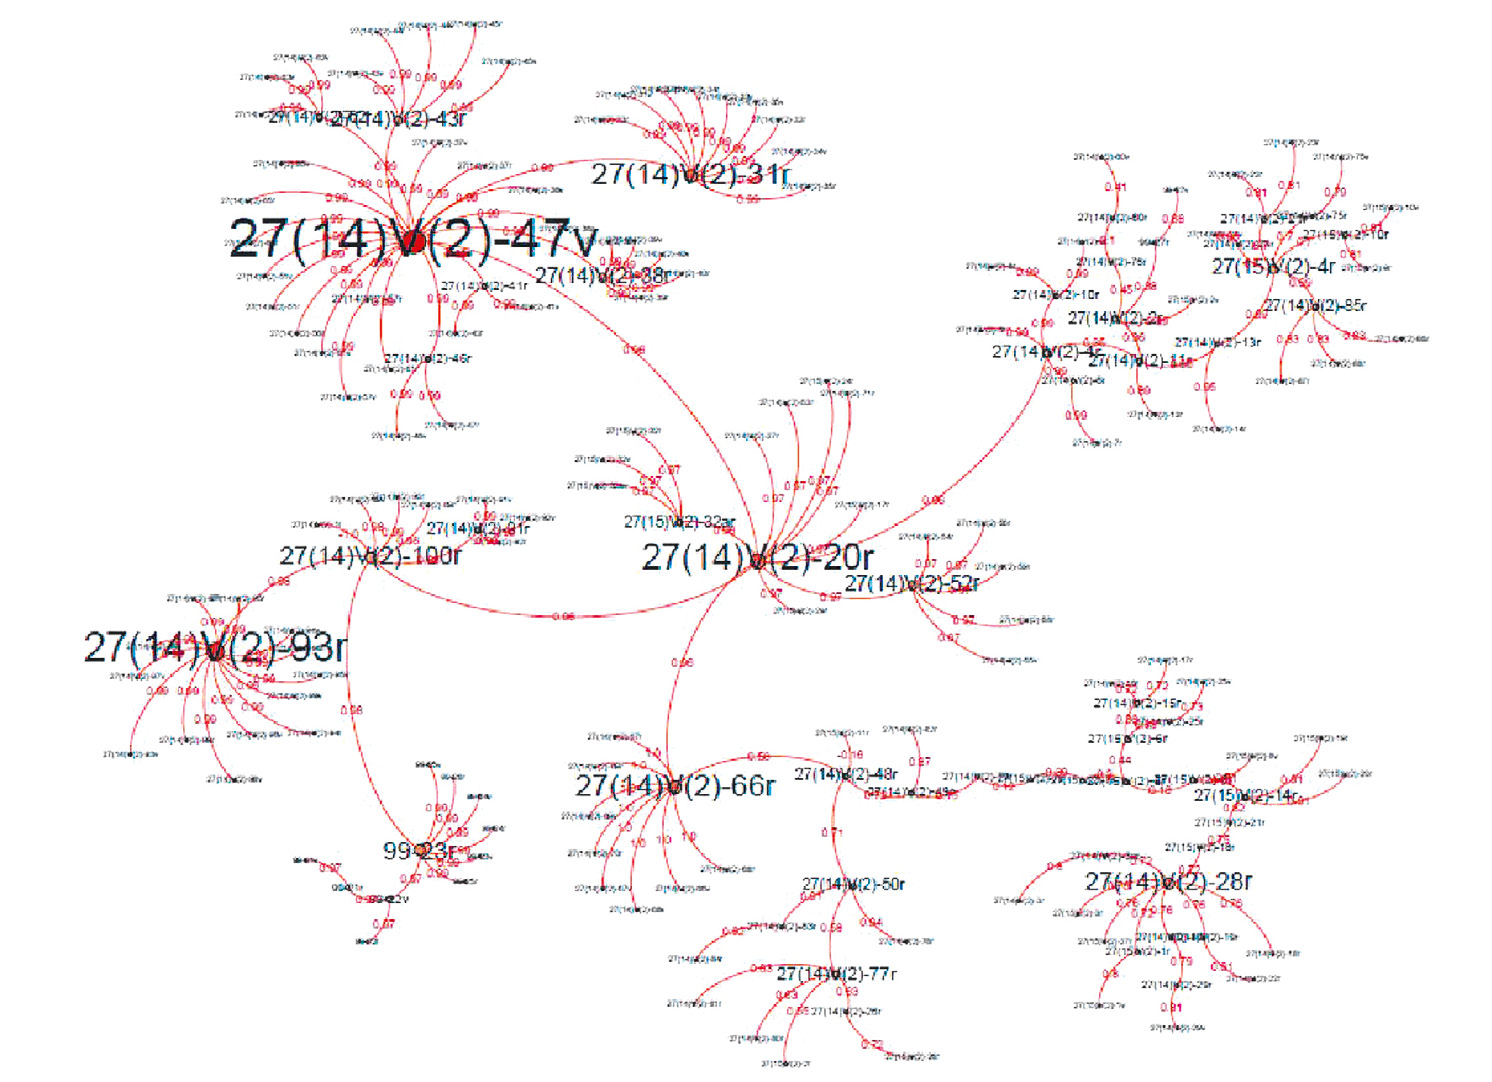
Fig. 6 – Auto-CM graph filtered through the degree parameter.
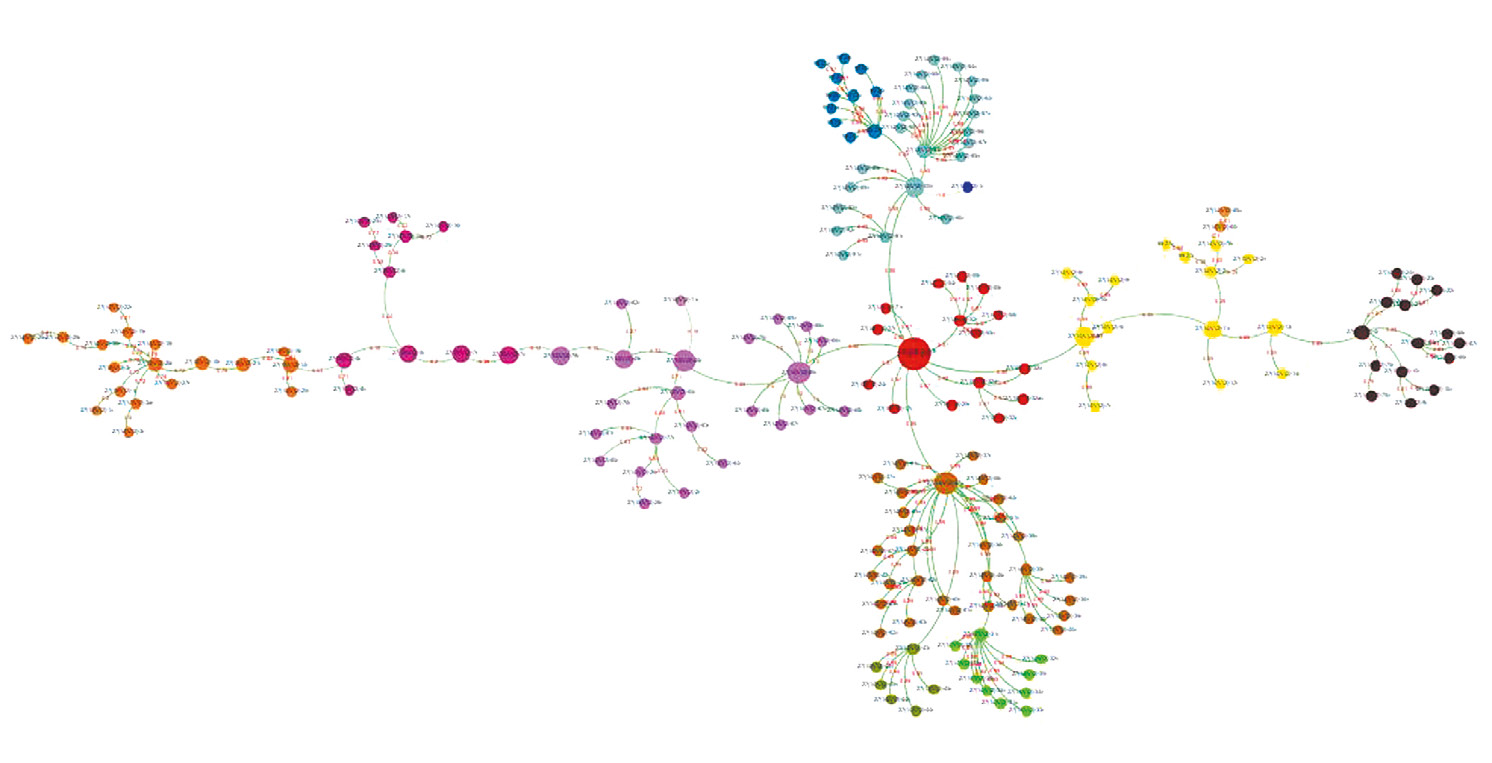
Fig. 7 – A possible chronological visualisation of Auto-CM graph.
Celani S. 2014, Artificial adaptive systems for philological analysis: the Pessoa case, Archeologia e Calcolatori 6