Volumes / Journal / 7 - 1996 / Baxter M., Beardah C.
Click on any image to open slideshow
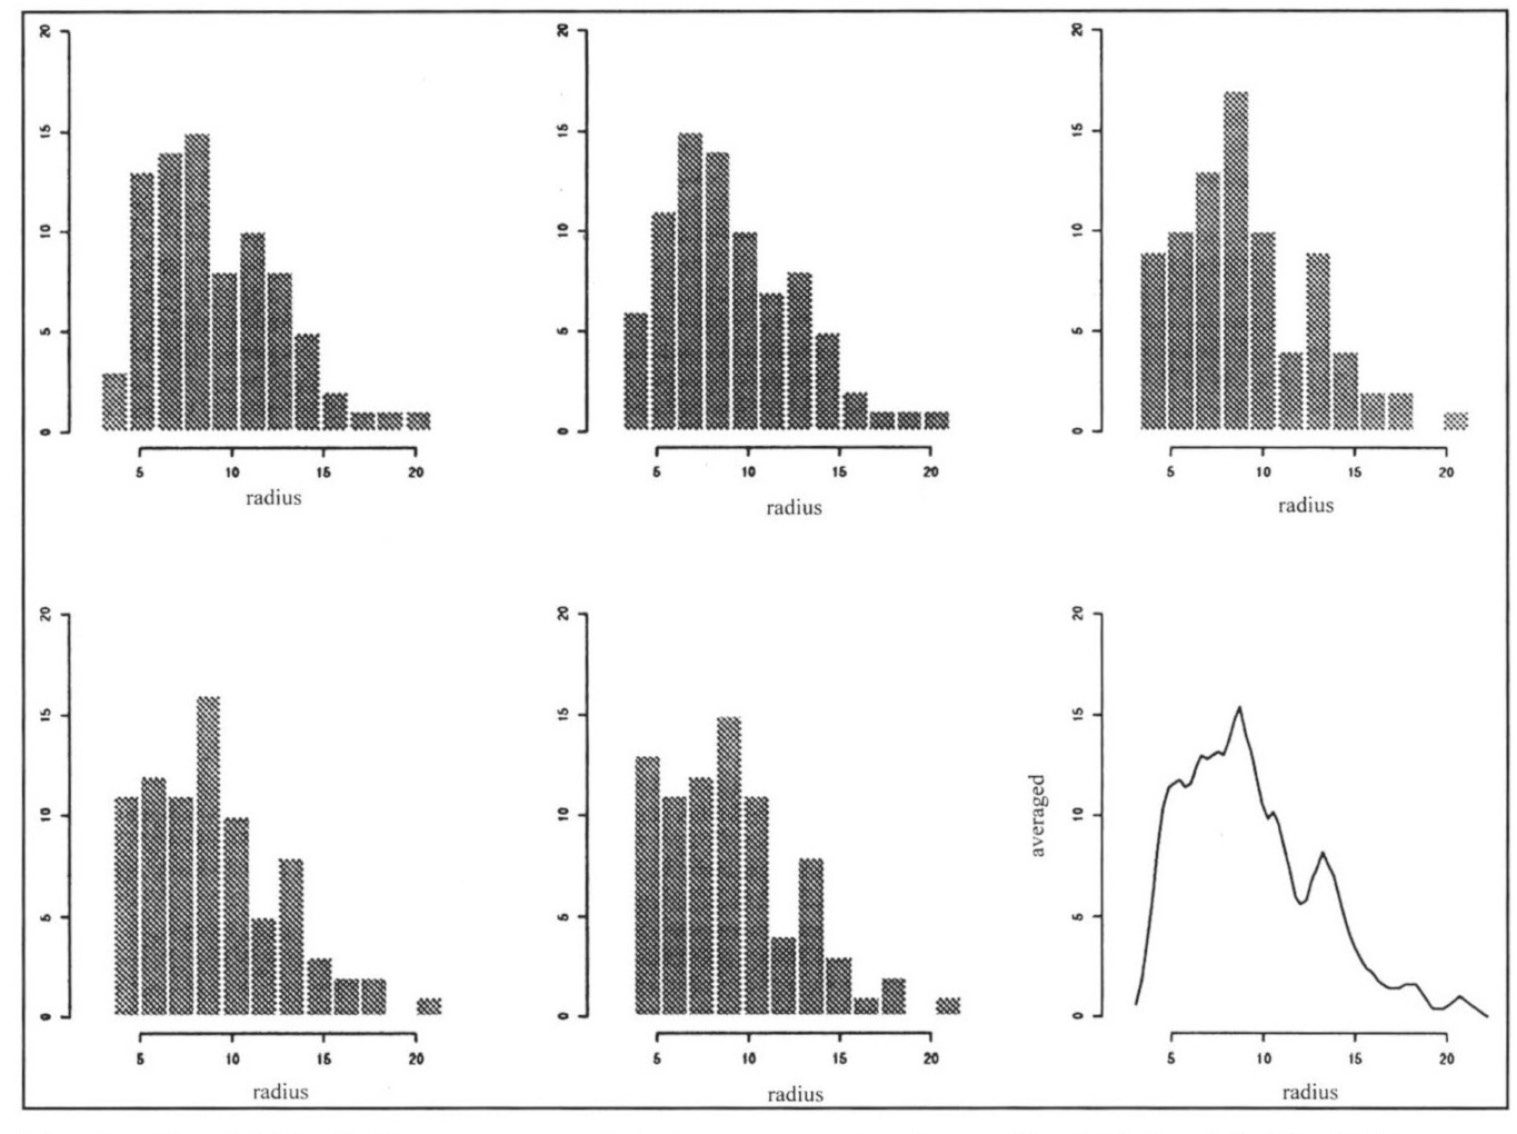
Fig. 1 – Five ‘shifted’ histograms and their average for the radii of 81 Danish ...
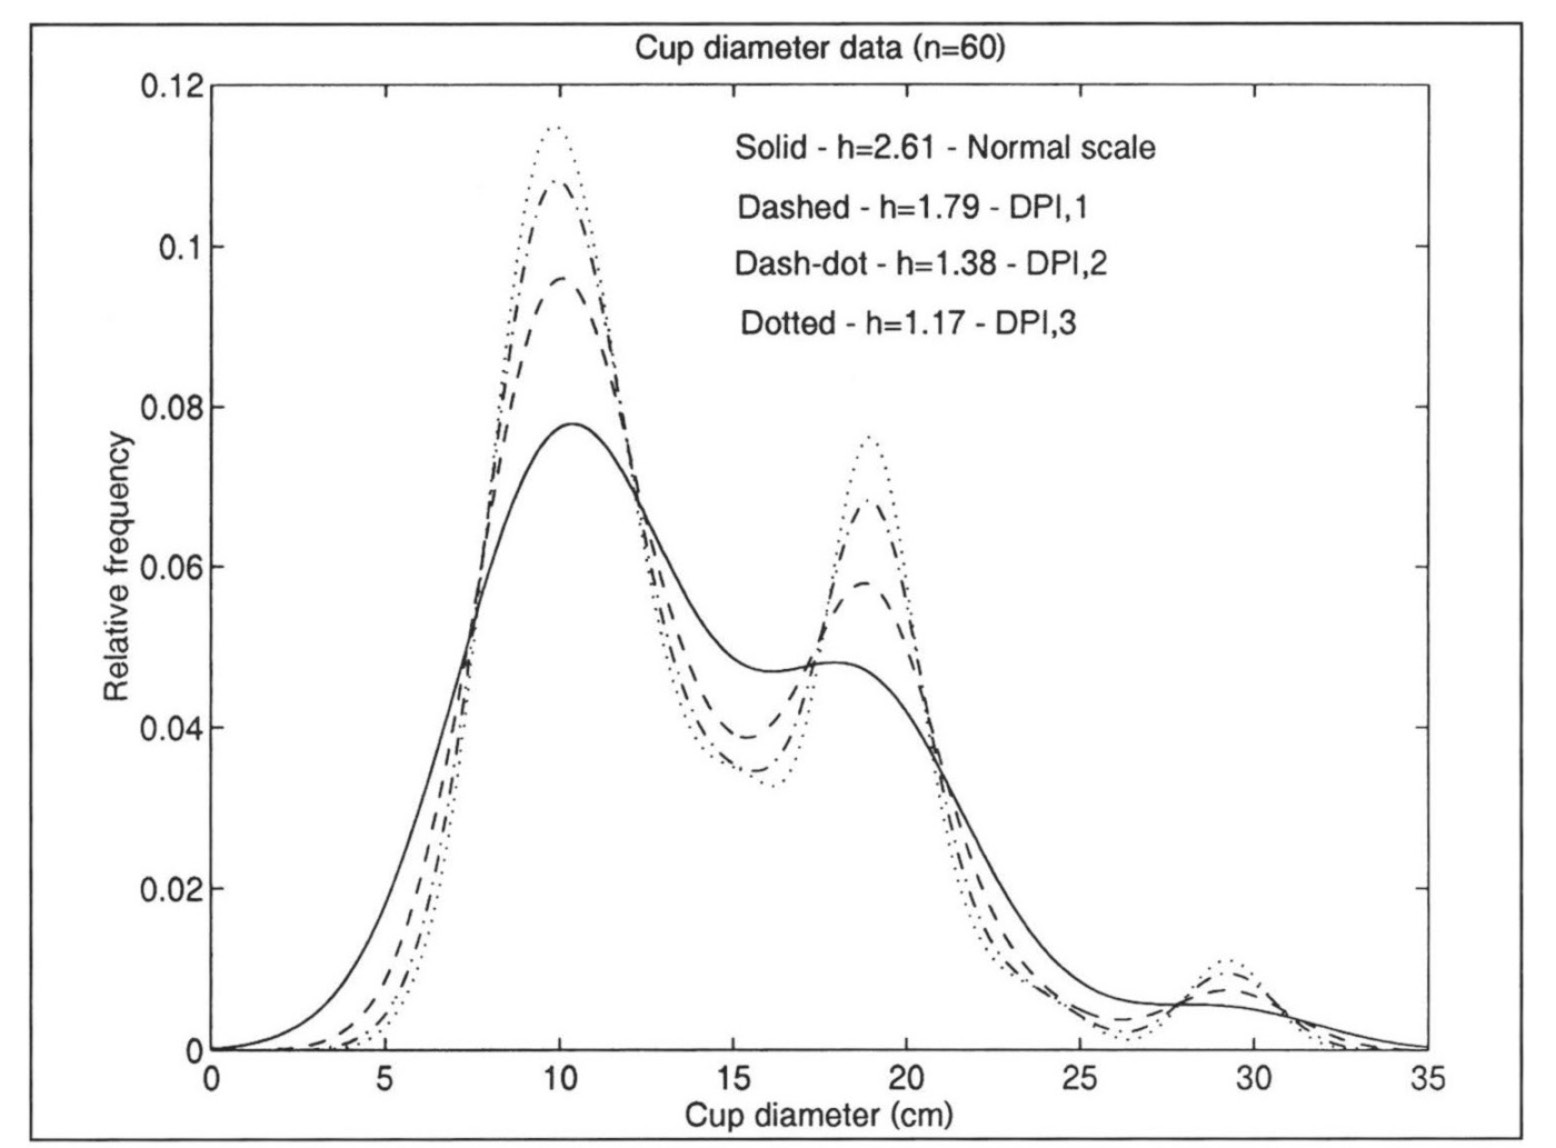
Fig. 2 – Four different h selection strategies generating KDEs based upon data r...
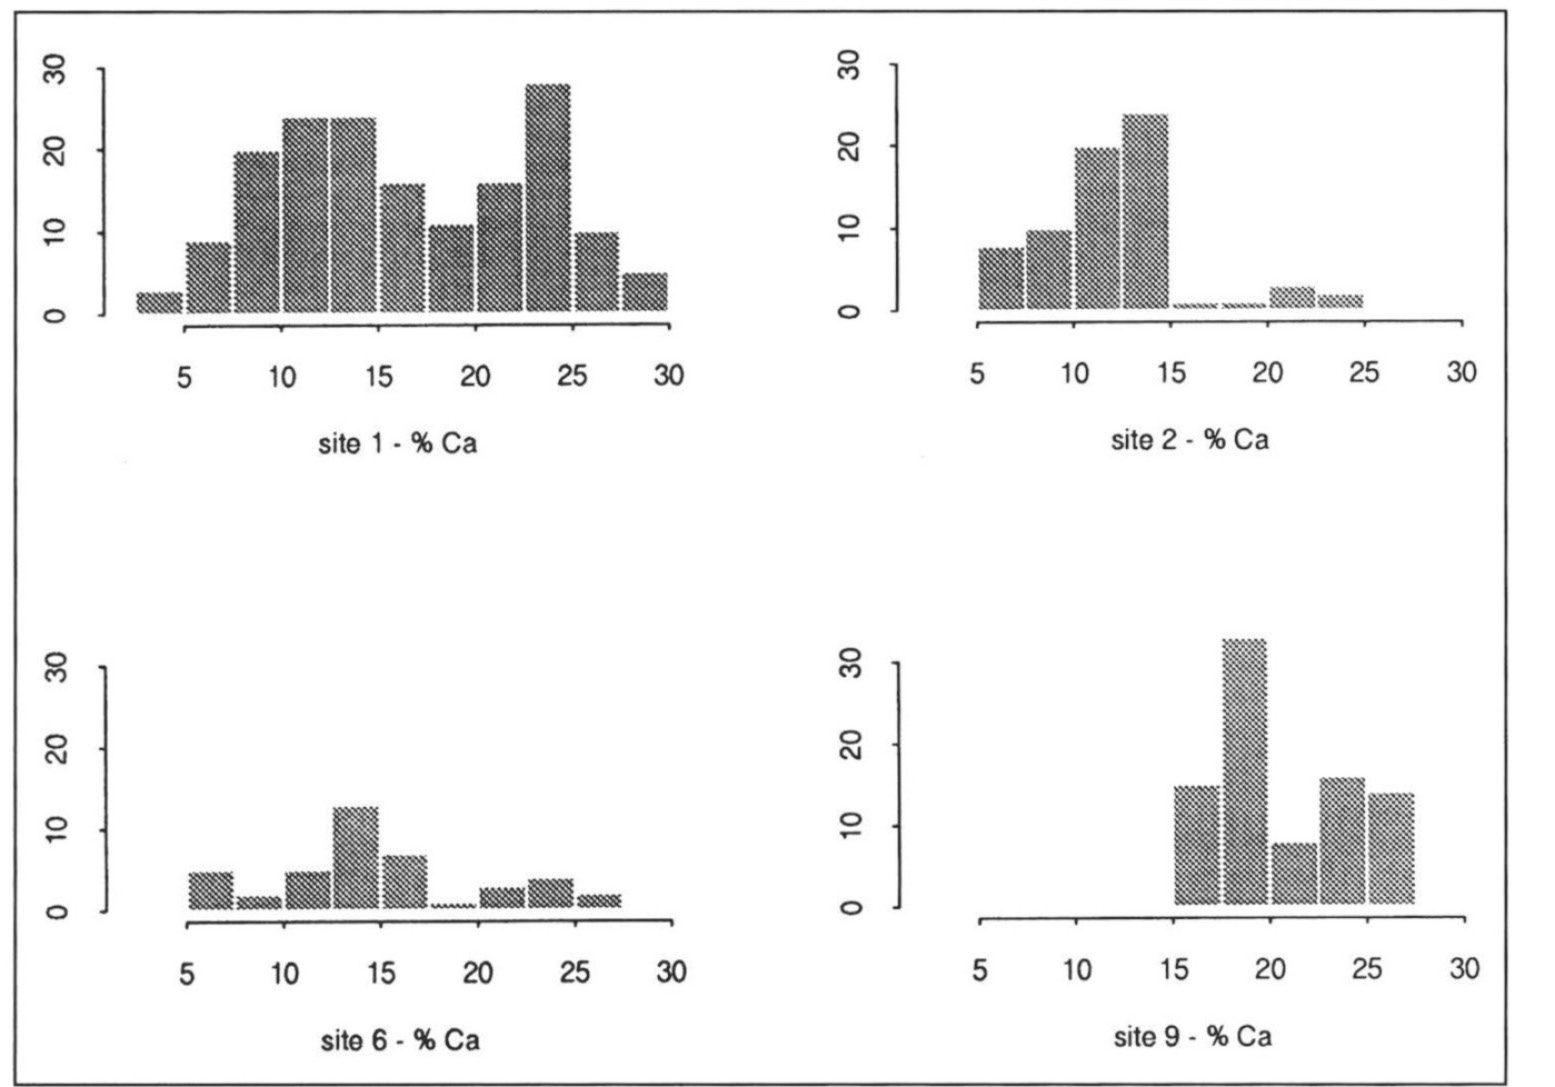
Fig. 3 – Histograms showing the distribution of calcium in specimens of glass fr...
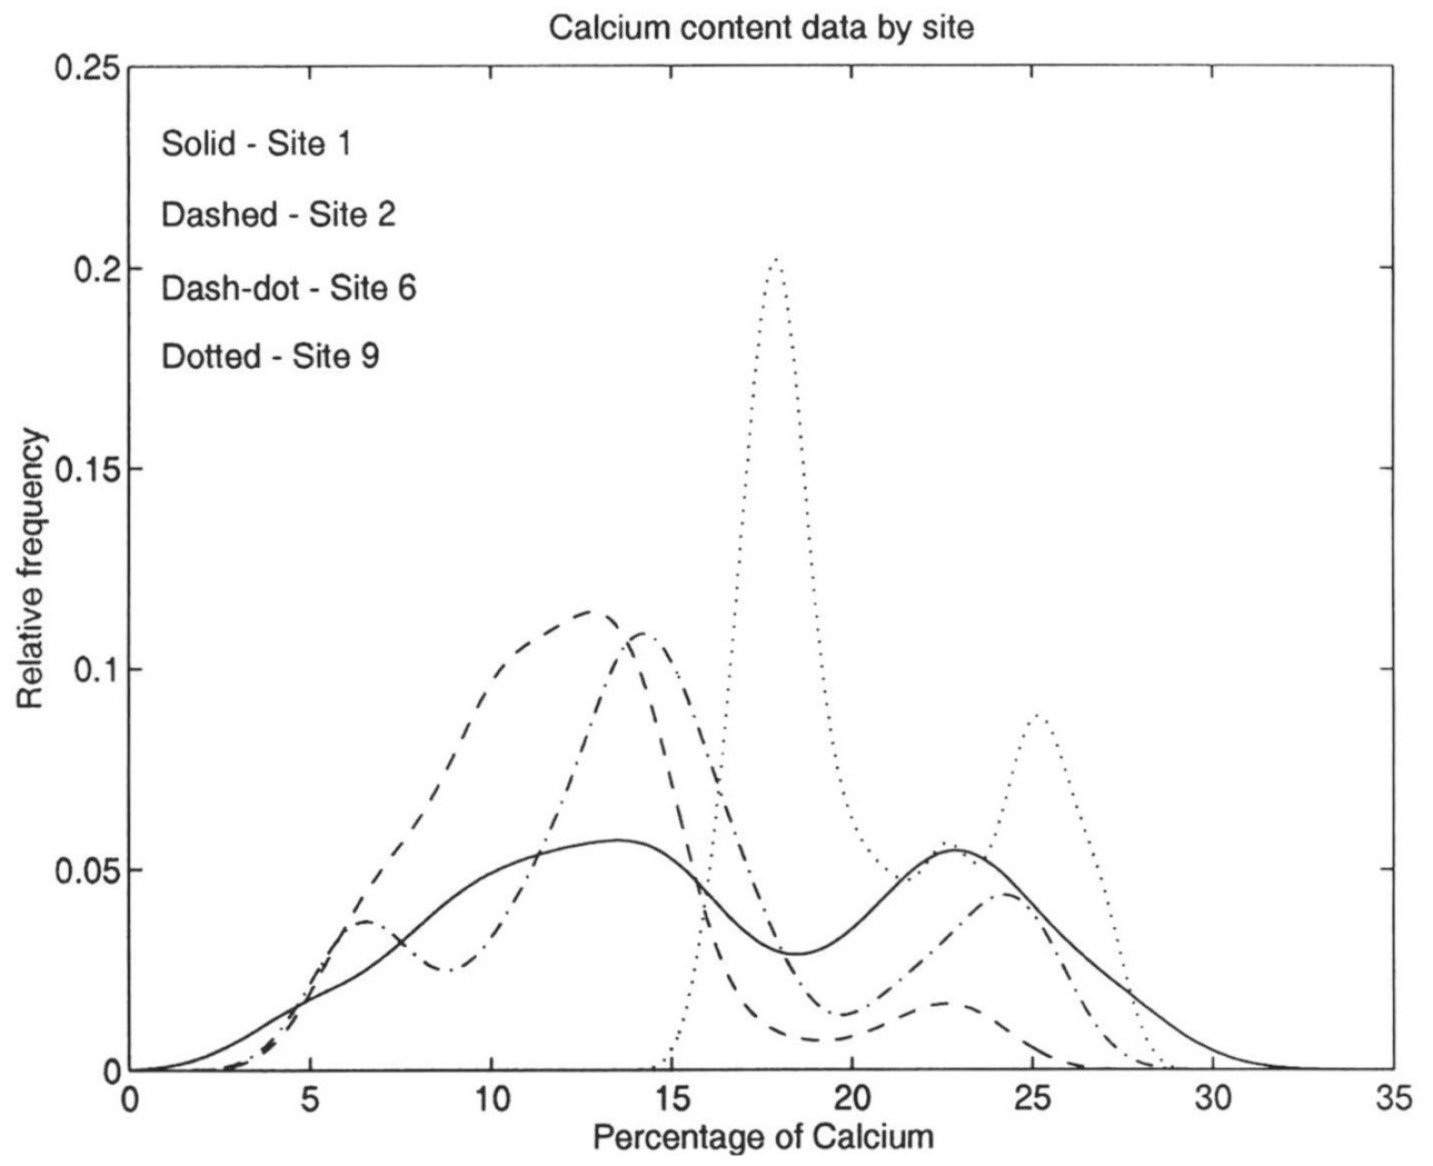
Fig. 4 – KDEs showing the distribution of calcium in specimens of glass from fou...
Baxter M., Beardah C. 1996, Beyond the histogram. Improved approaches to simple data display in archaeology using kernel density estimates, Archeologia e Calcolatori 7