Volumes / Journal / 26 - 2015 / Mallet Gauthier S., Choulakian V.
Click on any image to open slideshow
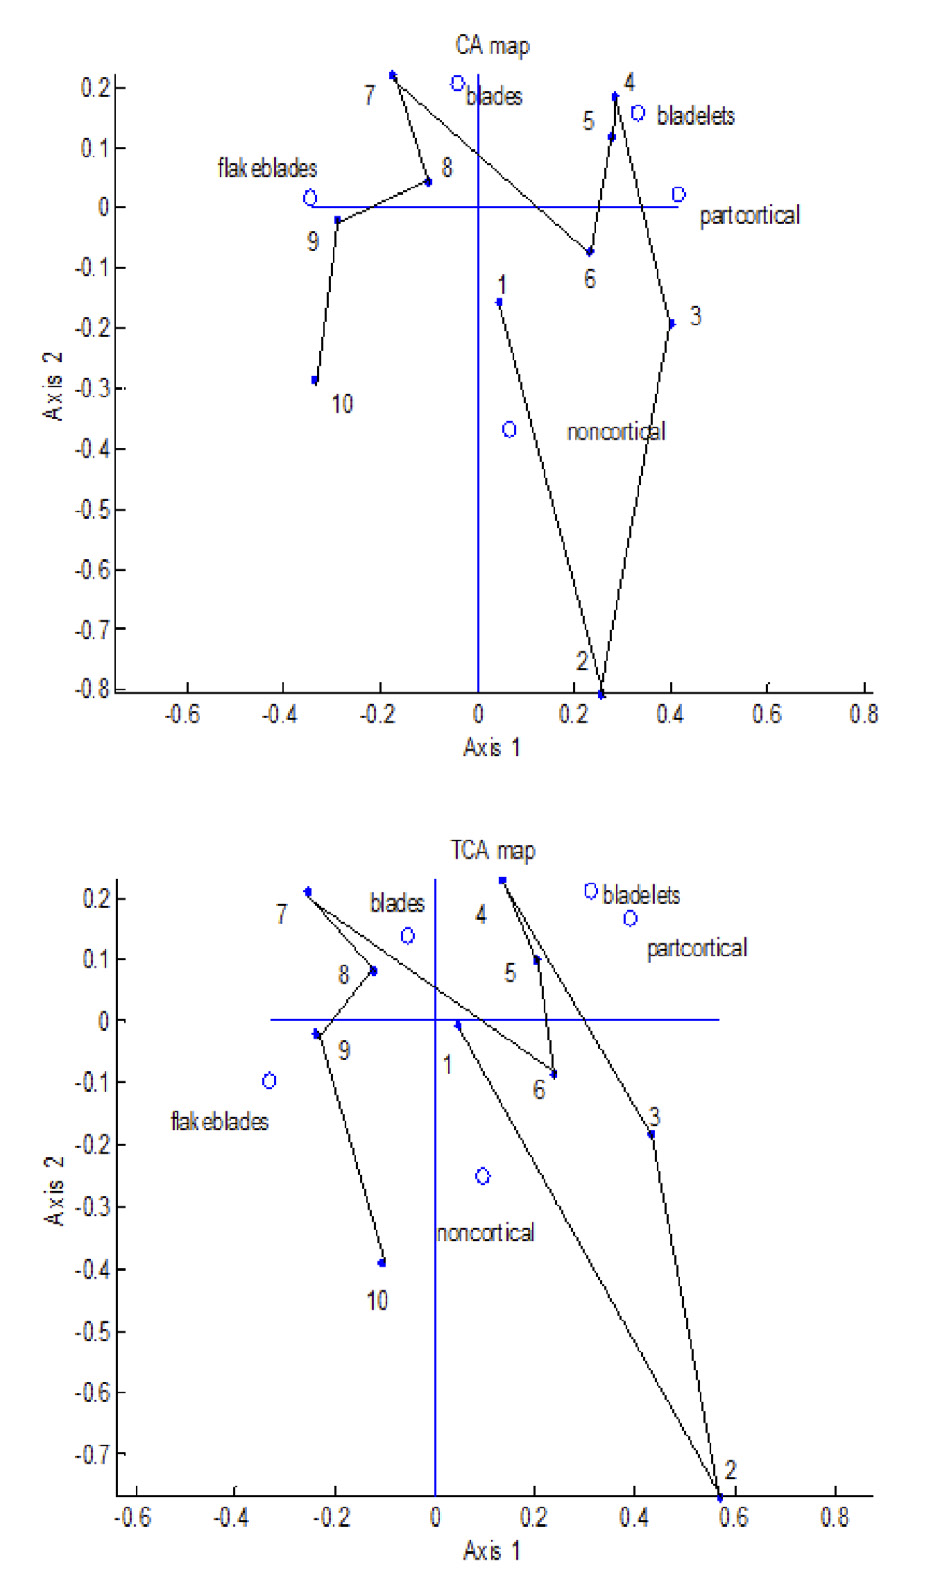
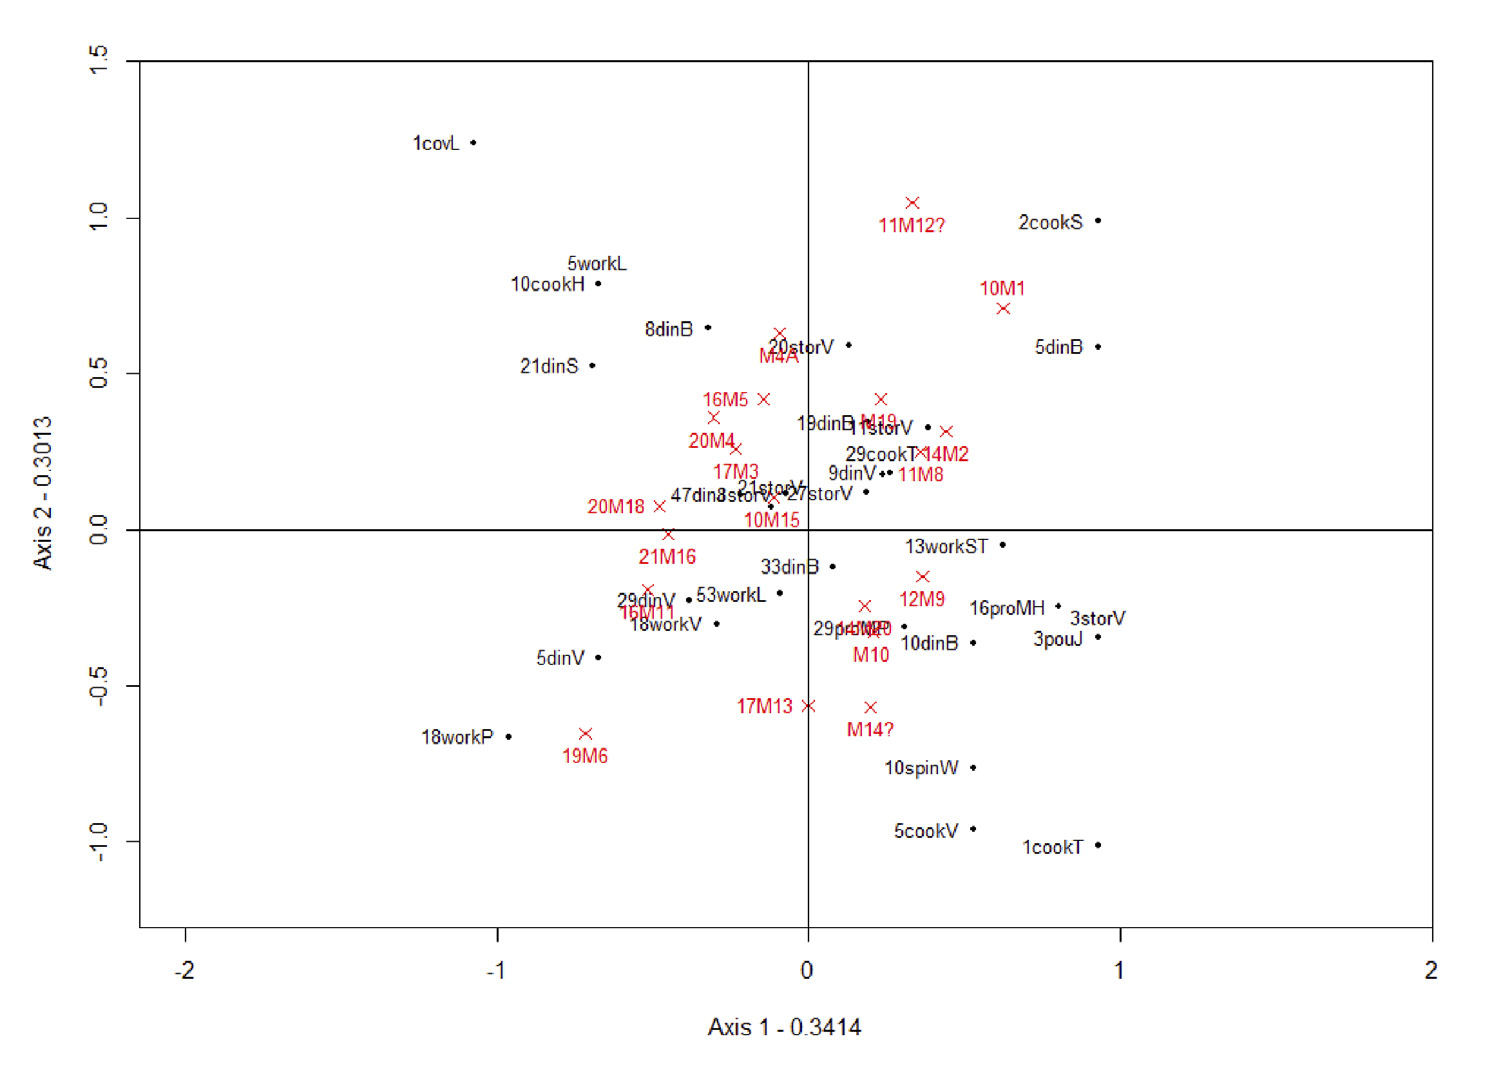
Fig. 1 – CA and TCA maps of Ksar Akil data.
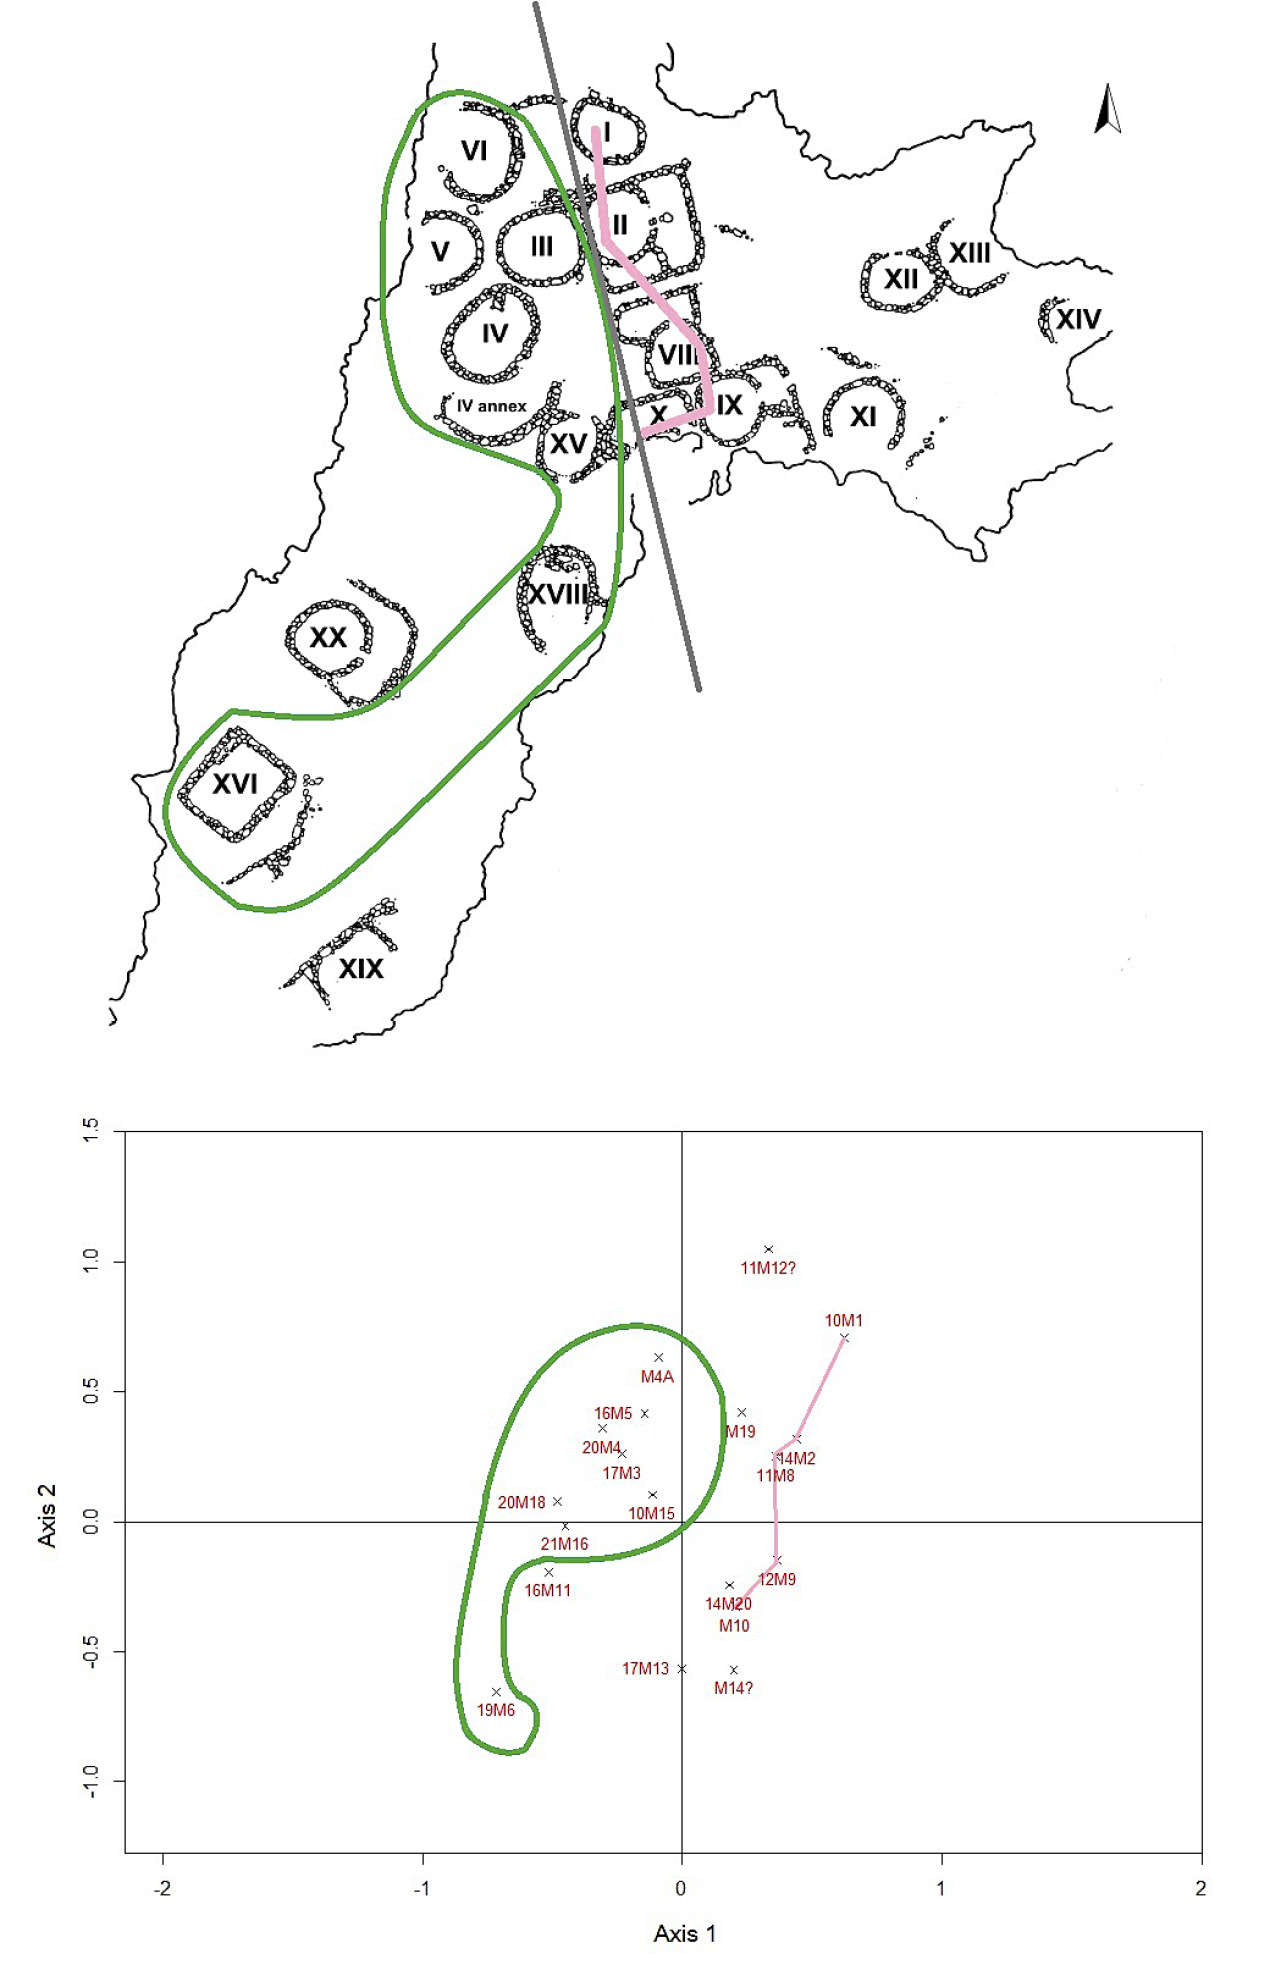
Fig. 2 – Geographical map of the studied huts (upper) and TCA display of the hut...
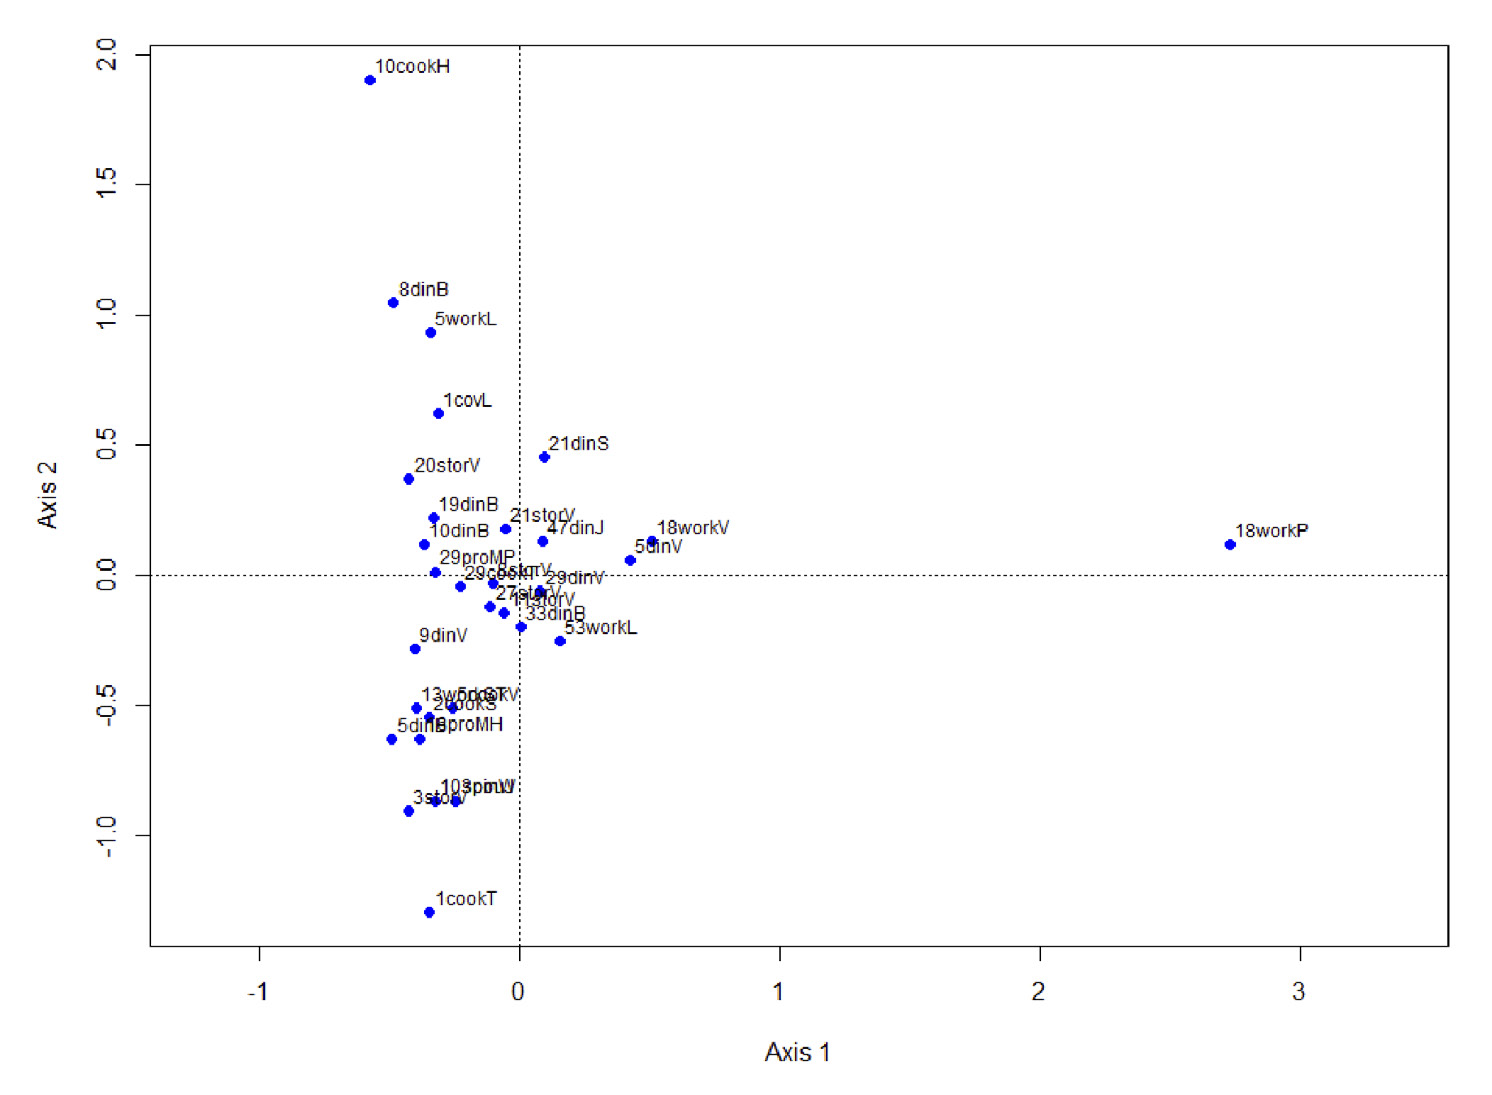
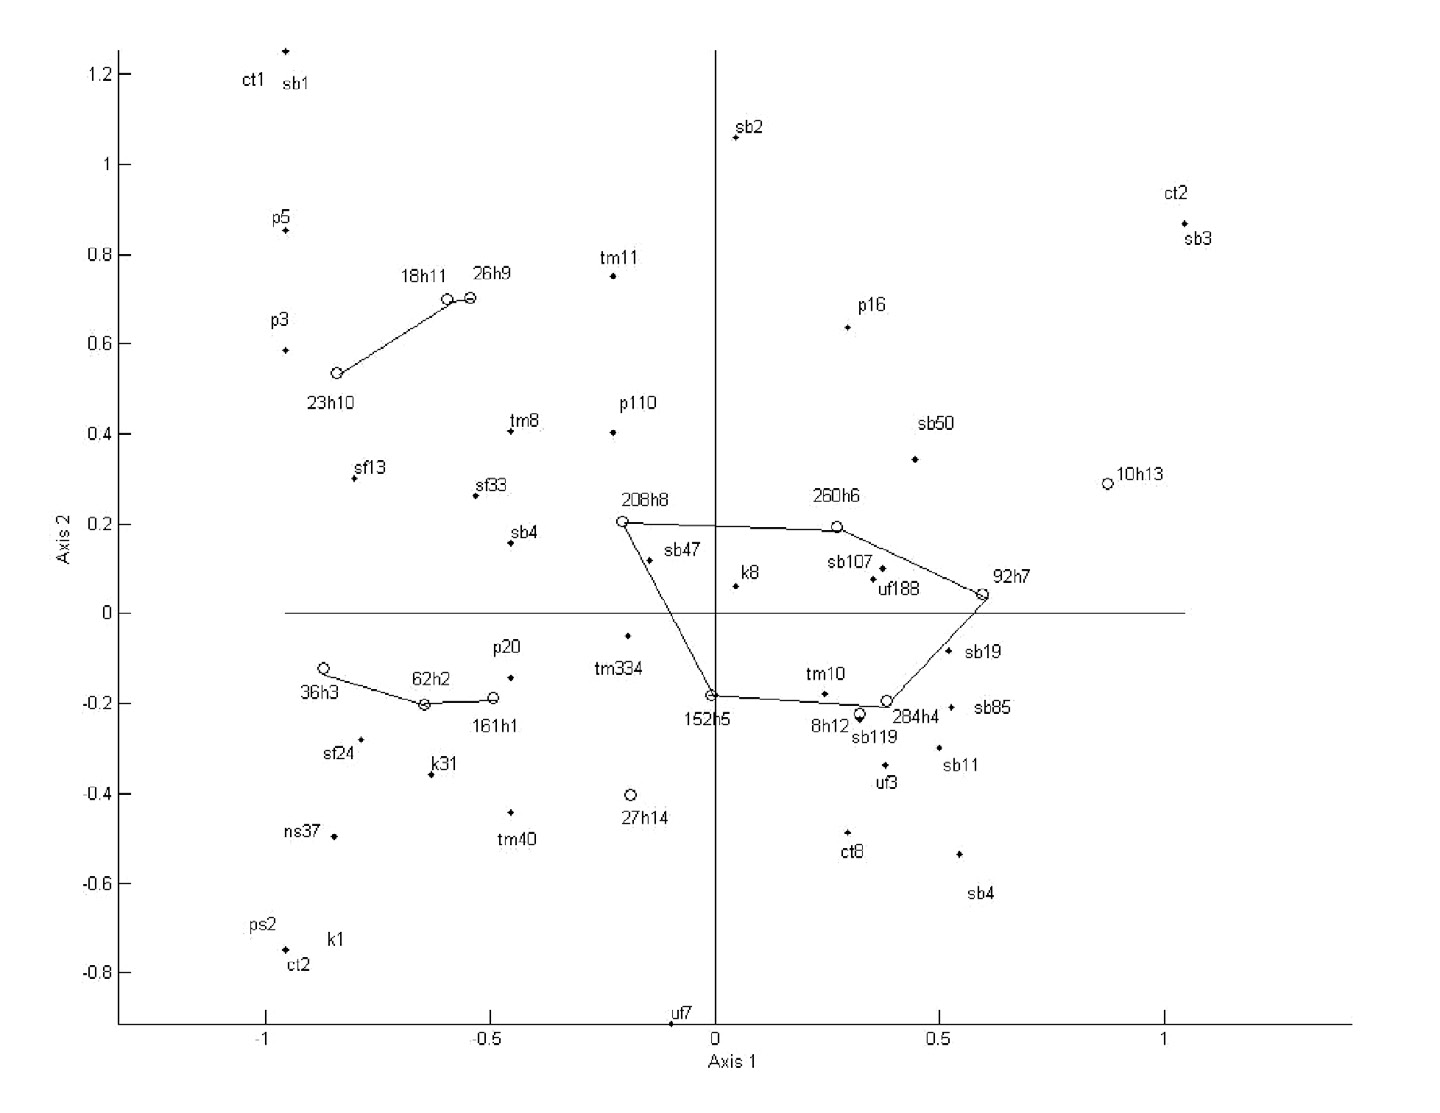
Fig. 3 – CA map of the 31 object types. In each label, the number represents the...
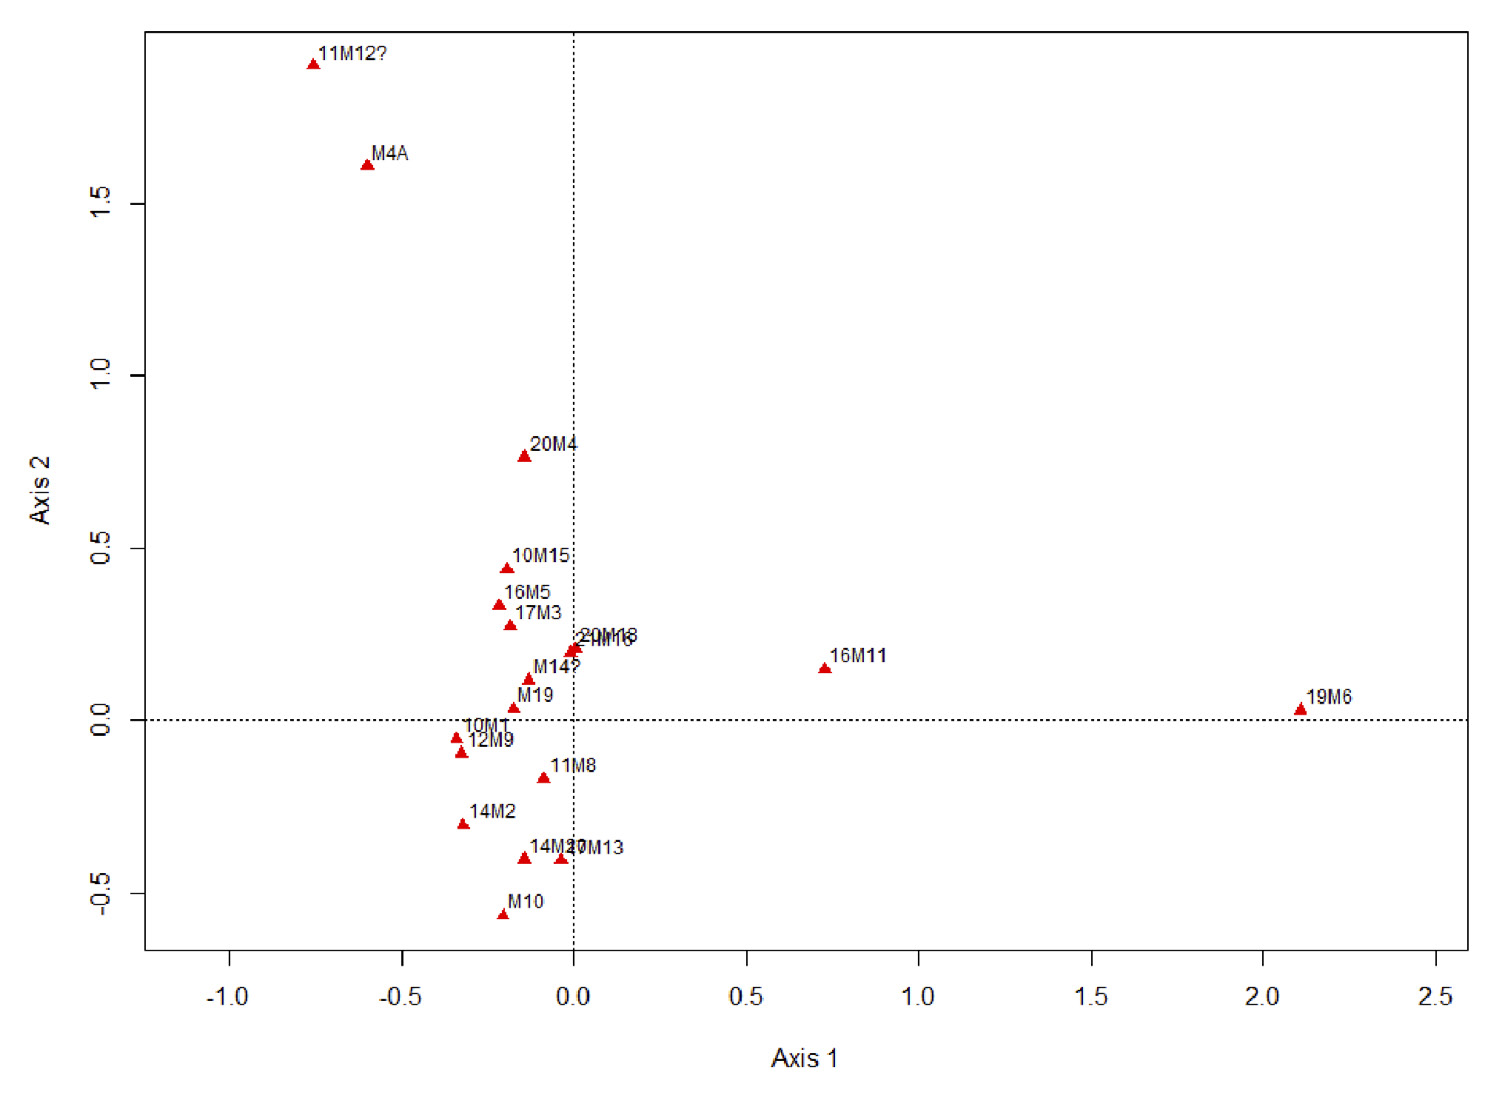
Fig. 4 – CA map of the 19 huts. In each label, the number represents the surface...
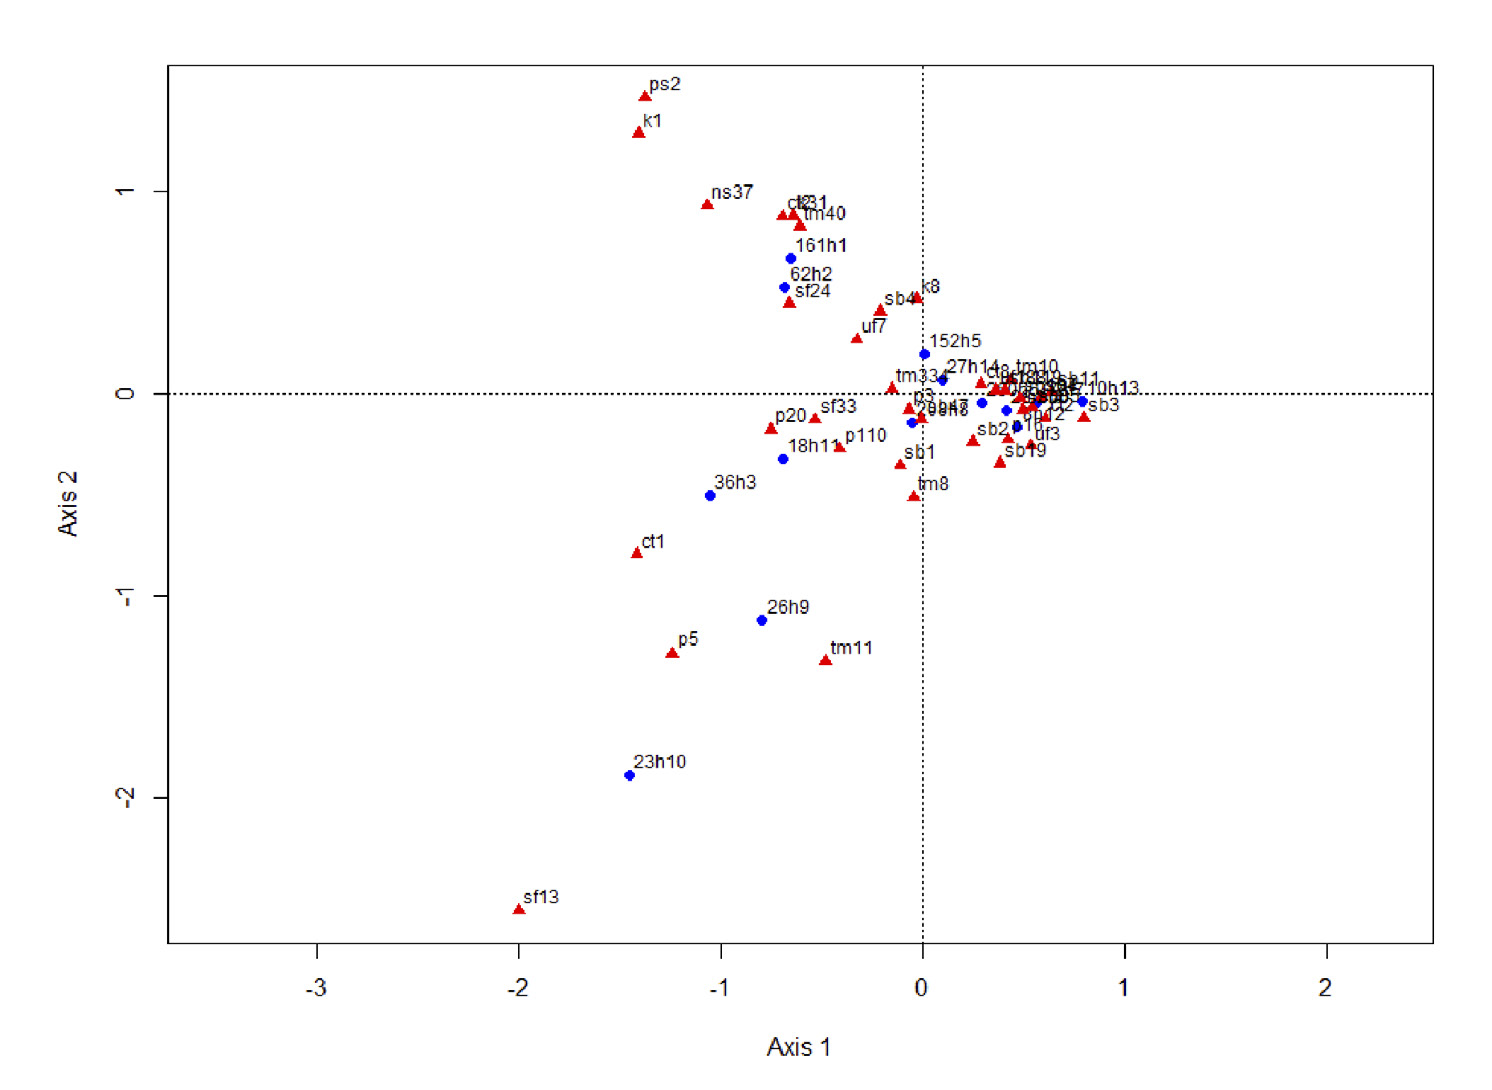
Fig. 5 – TCA map of the 31 object types and the 19 huts of Punta Milazzese.
Fig. 6 – CA map of the Iversfjord data.
Fig. 7 – TCA map of the Iversfjord data.
Mallet Gauthier S., Choulakian V. 2015, Taxicab correspondence analysis of abundance data in archaeology: three case studies revisited, Archeologia e Calcolatori 26