Volumes / Journal / 26 - 2015 / Guidi A.
Click on any image to open slideshow
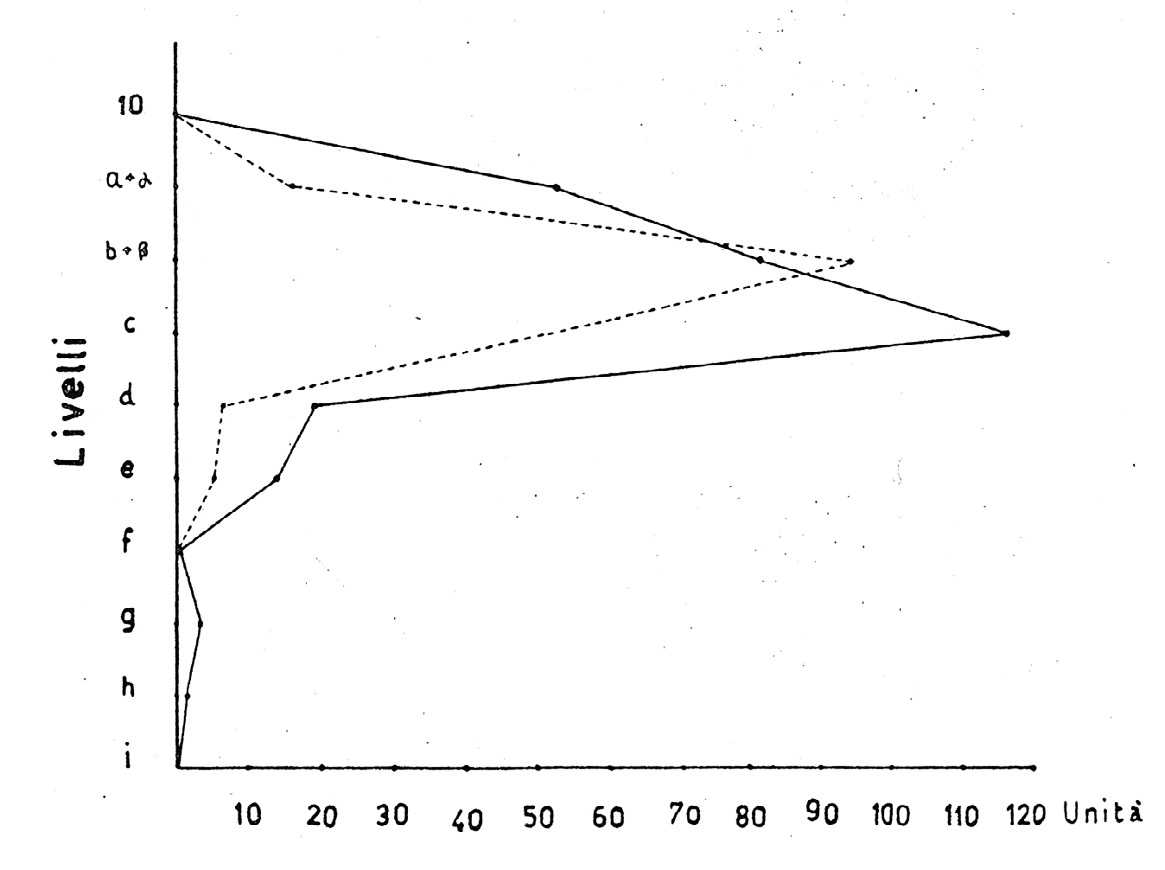
Fig. 1 – Coppa Nevigata. Correlation between cardium shells and michroliths (Pug...
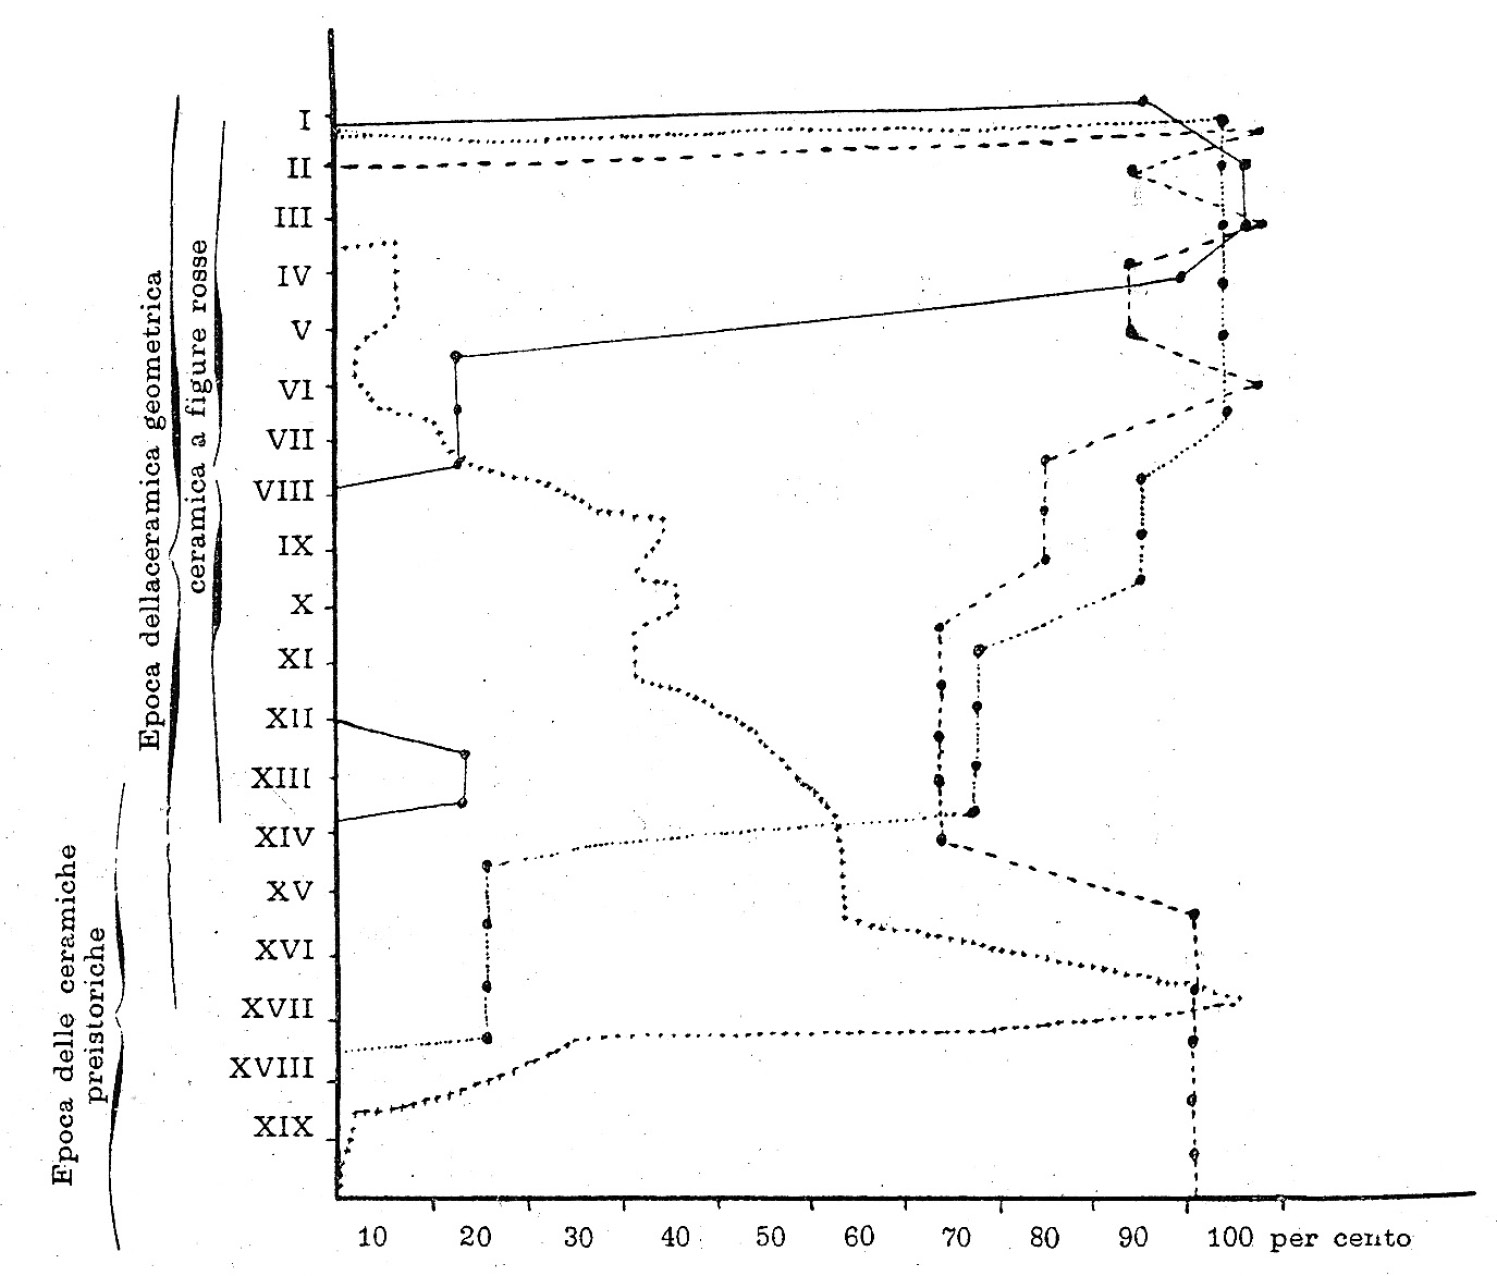
Fig. 2 – Quantitative graph of pottery from Altamura sounding A (Biancofiore 196...
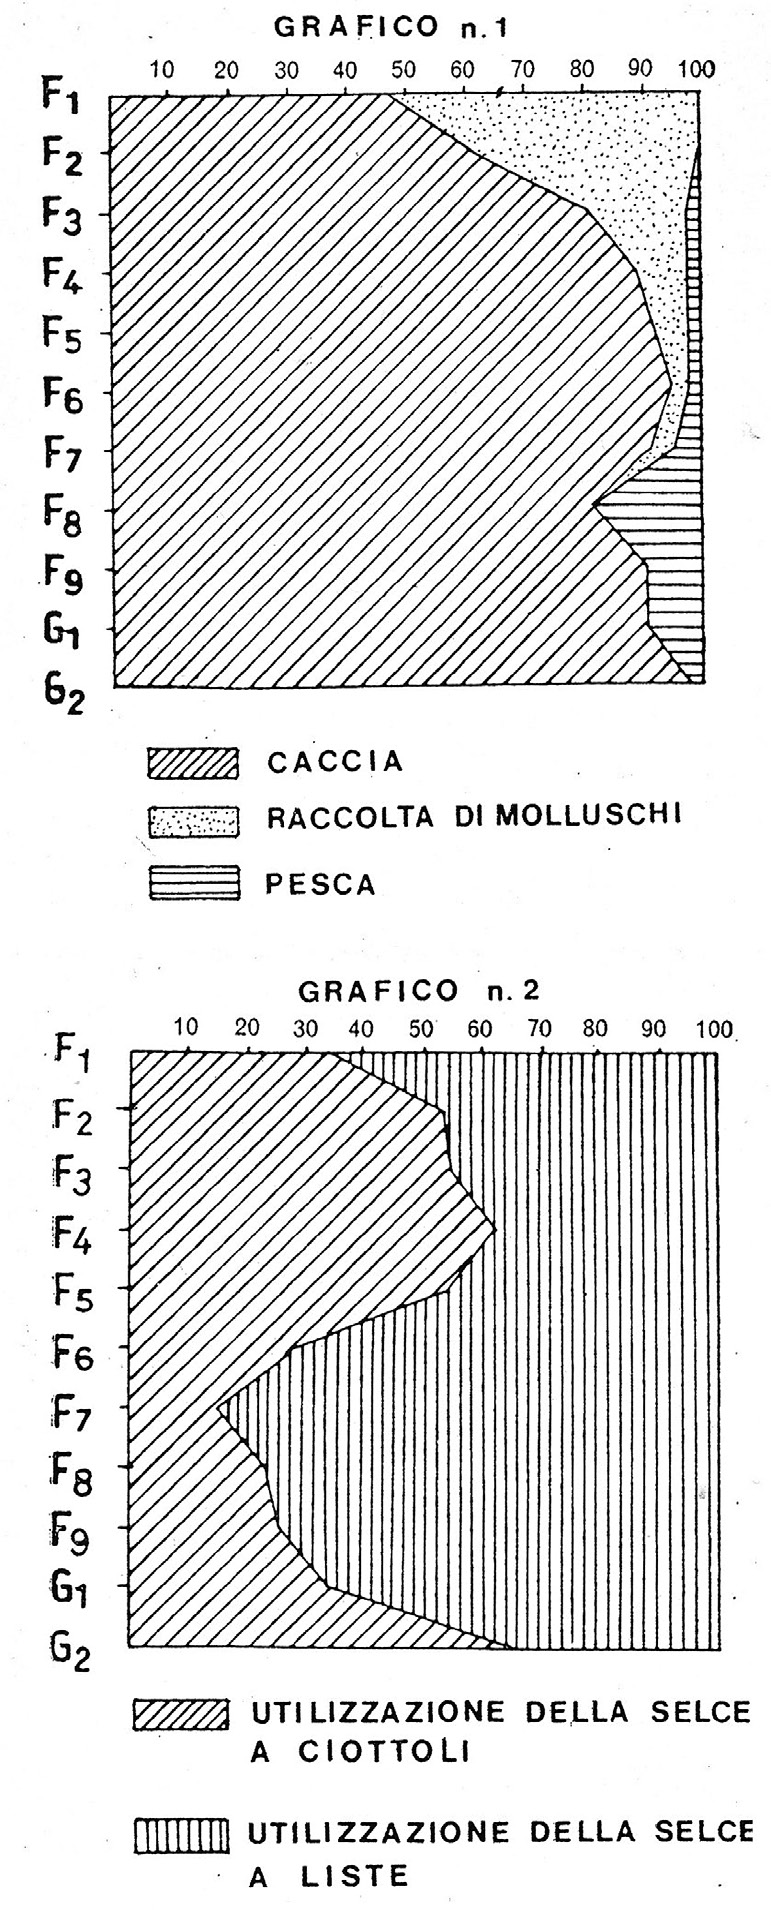
Fig. 3 – Quantitative graph of archaeozoological finds (graph 1) and of types of...
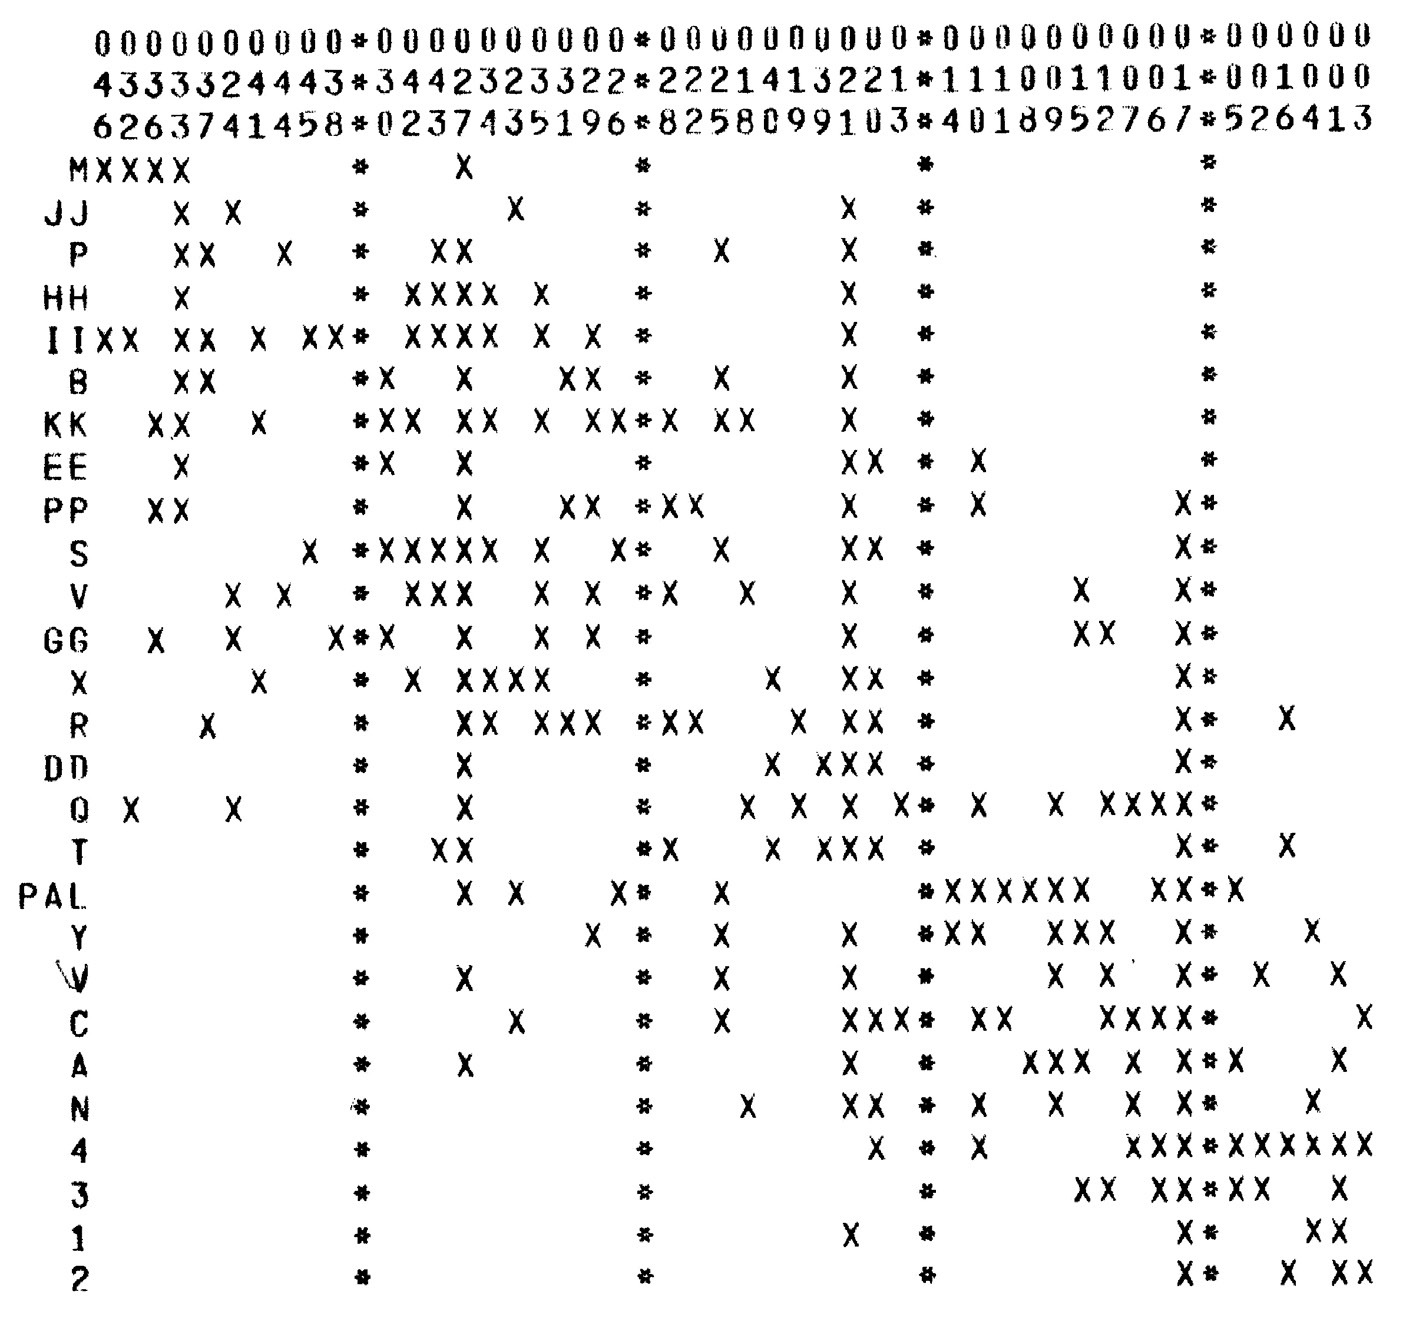
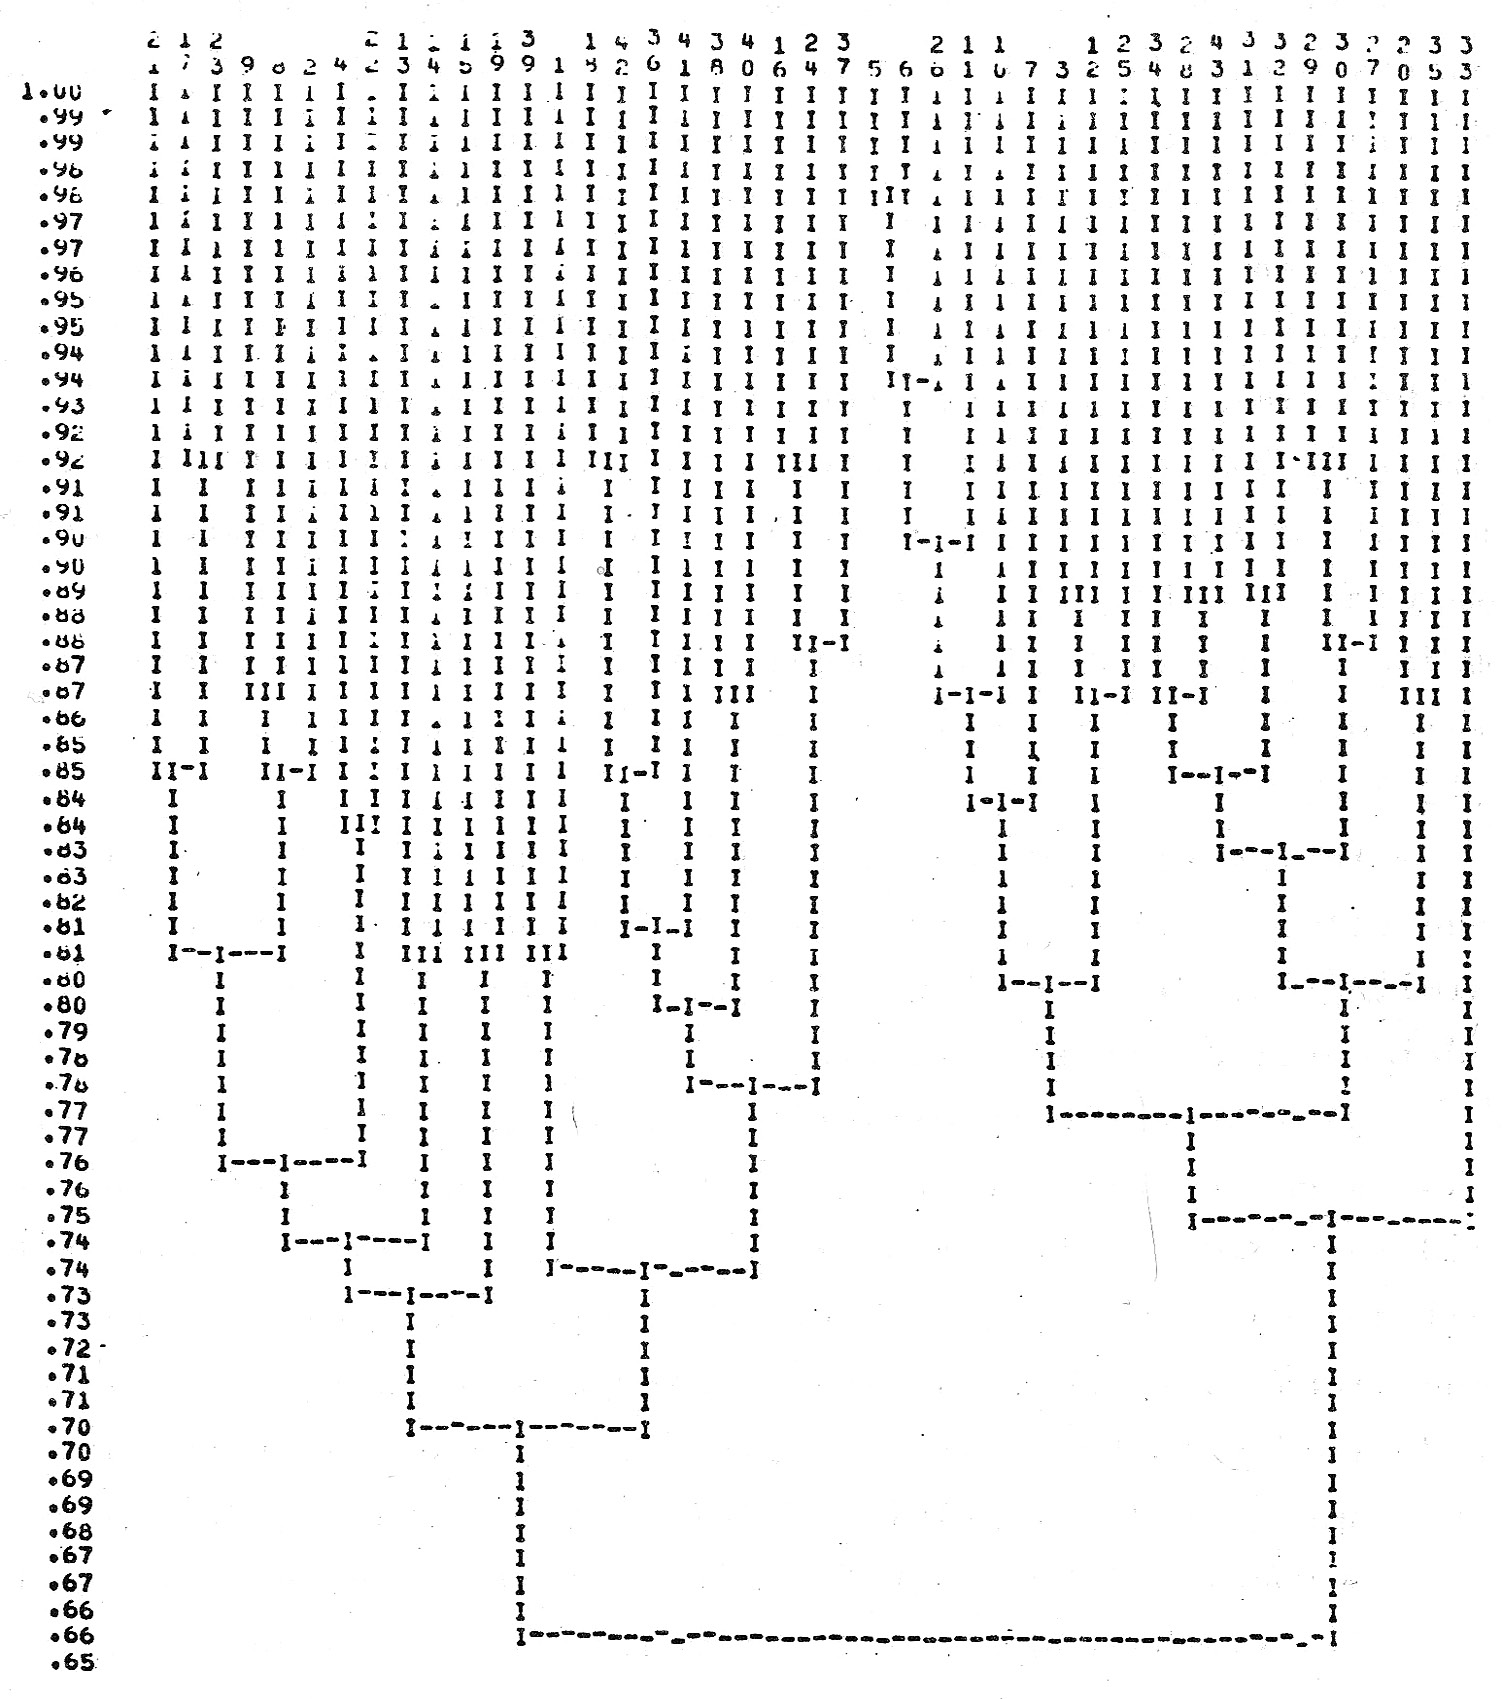
Fig. 4 – Computer-generated seriation (courtesy Paolo Peroni).
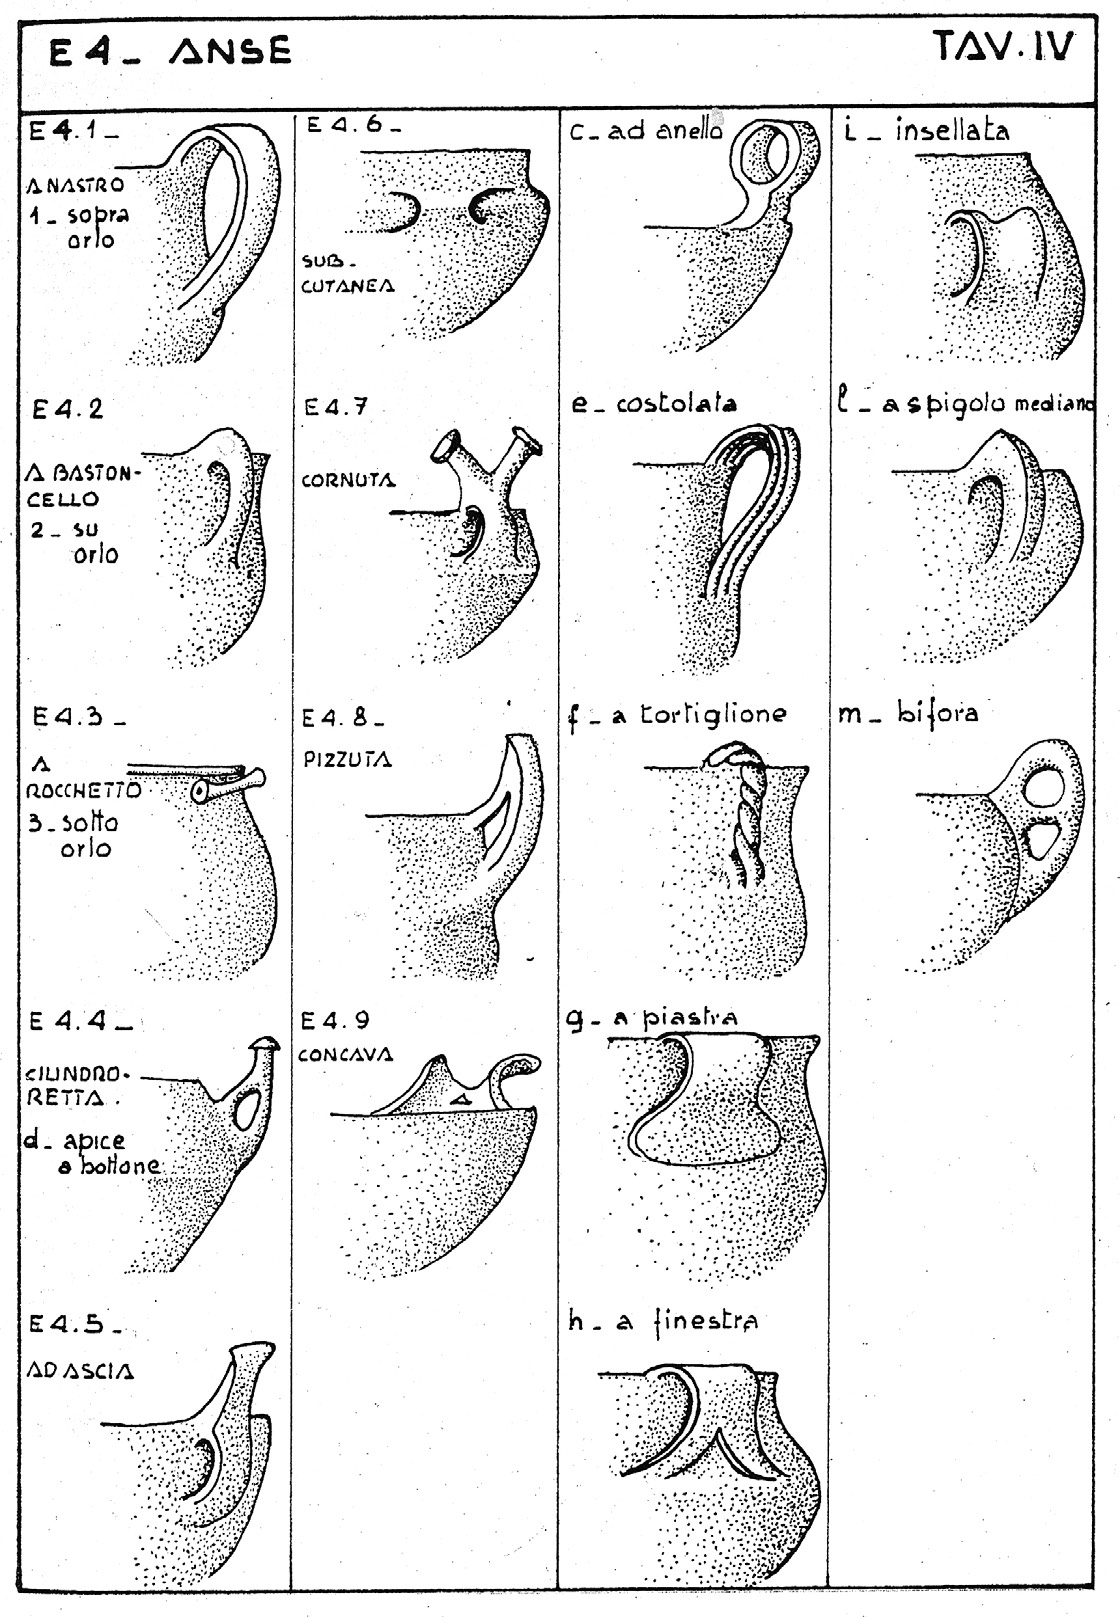
Fig. 5 – Example of protohistoric pottery descriptive code (Guerreschi 1971-1972...
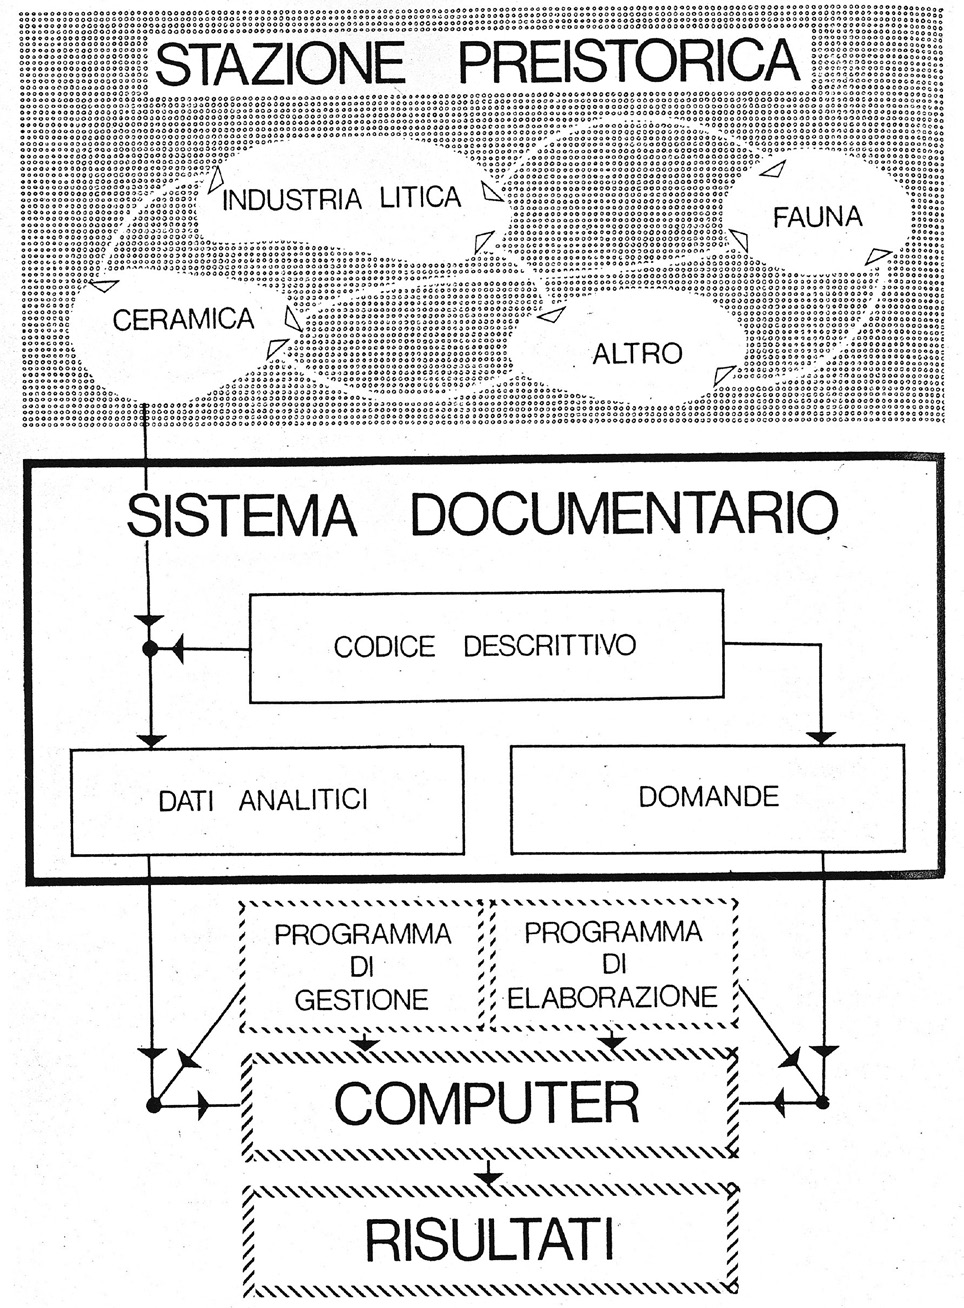
Fig. 6 – Model of interaction between archaeology and computers (Pezzoli 1976-19...
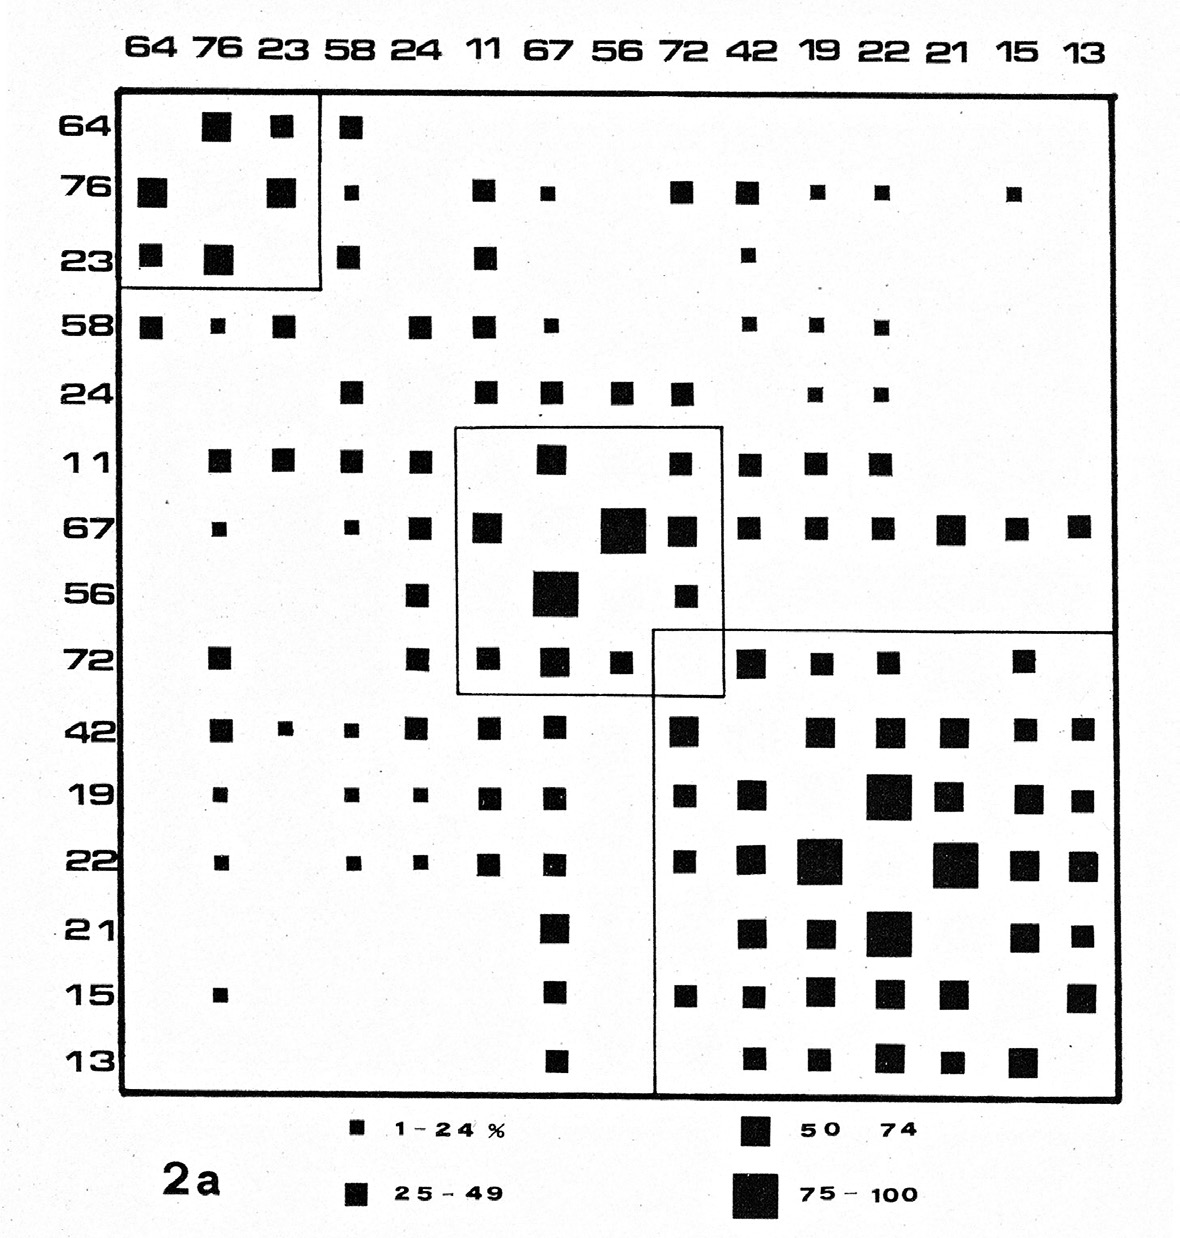
Fig. 7 – Correlation matrix of Southern Italy Eneolithic sites (Cazzella 1972)....
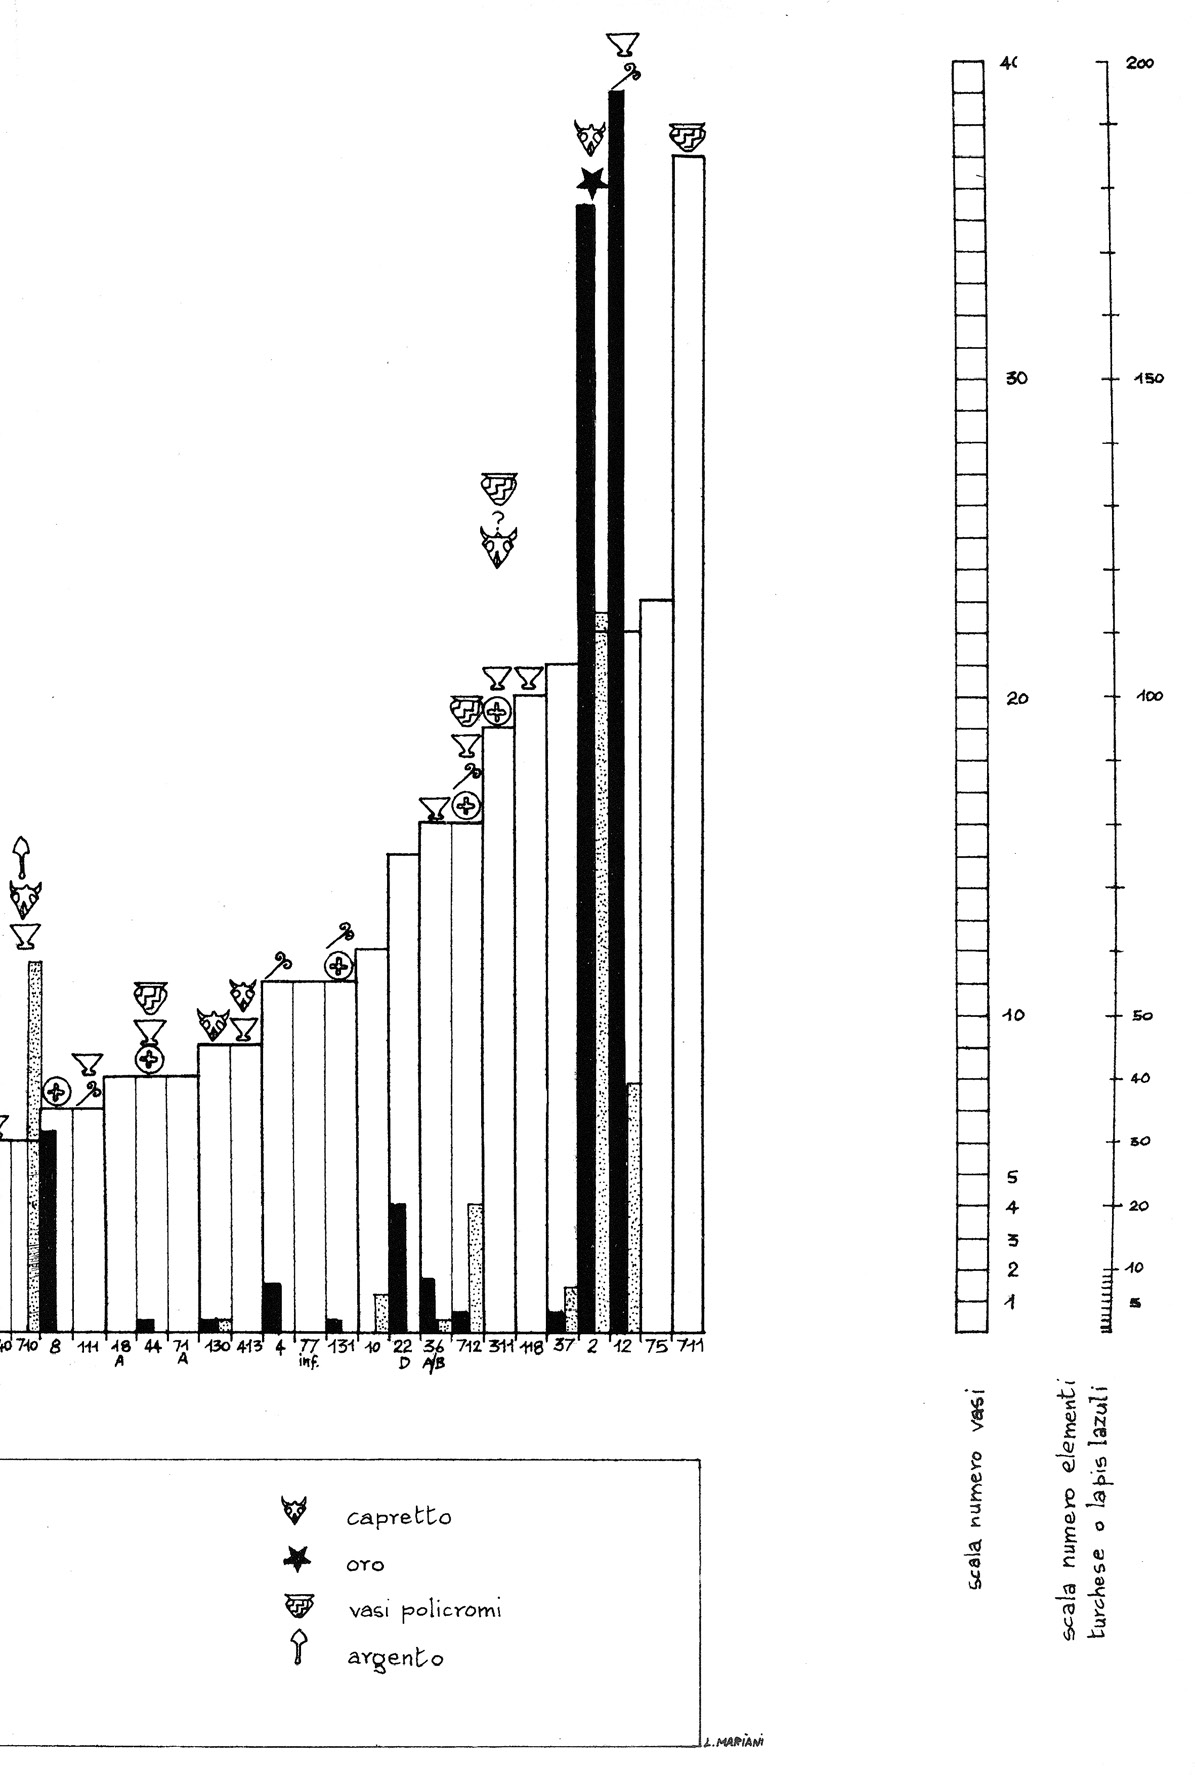
Fig. 8 – Shahr-i Sokhta graveyard richness curve (Tosi 1977).
Fig. 9 – Italian Upper Palaeolithic sites cluster analysis (Bietti et al. 1978)....
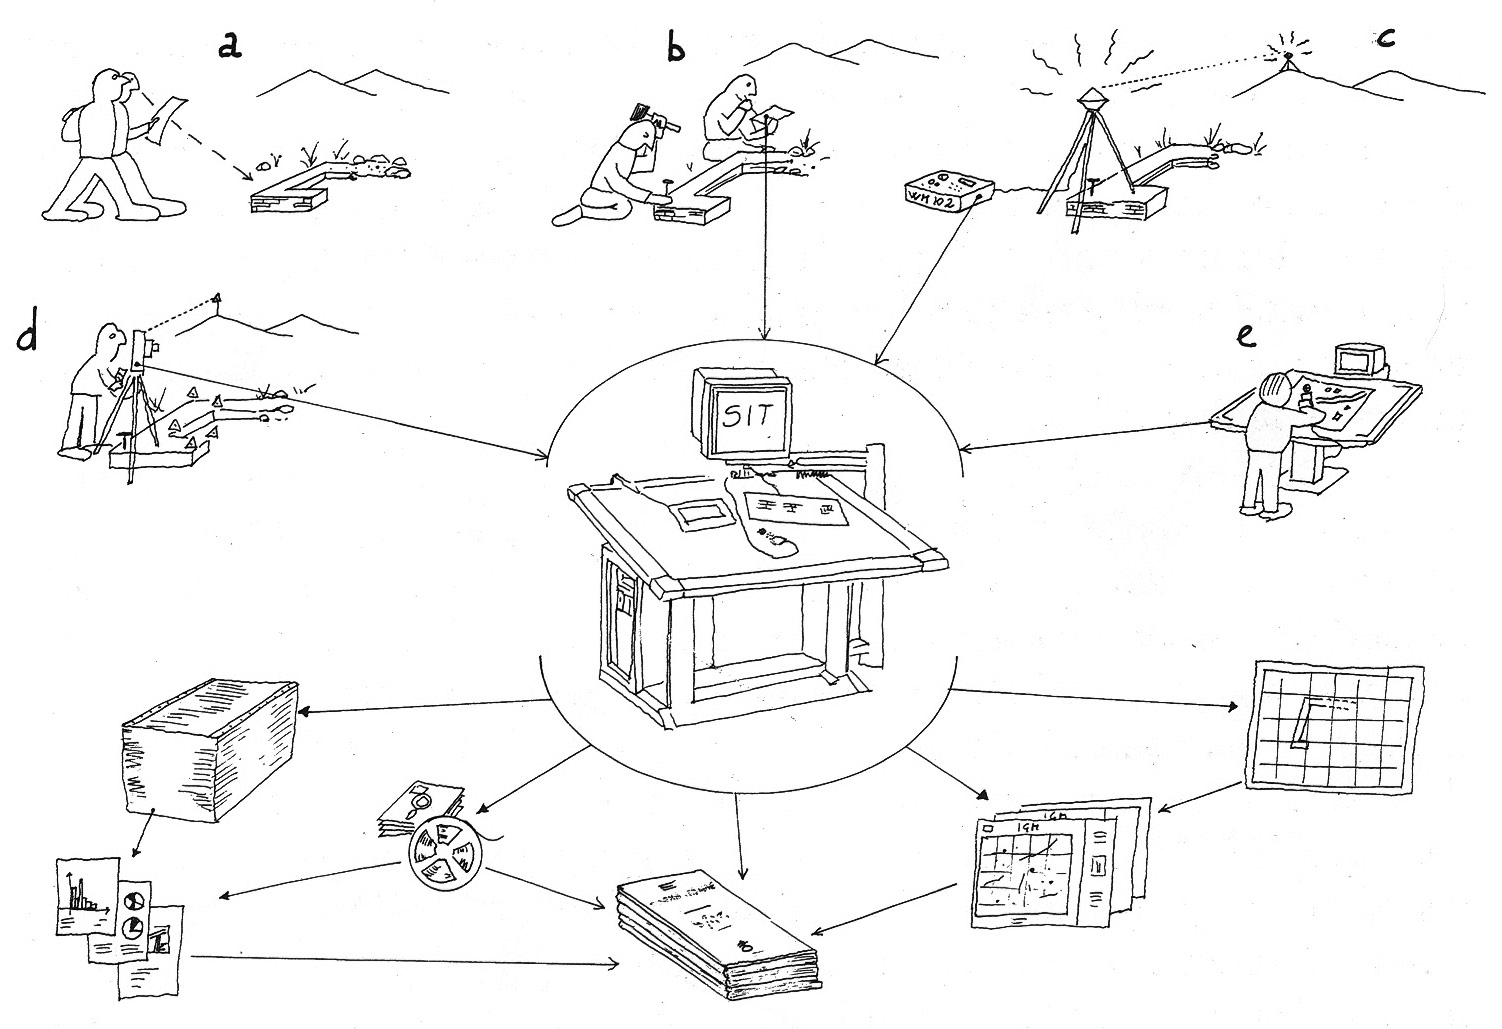
Fig. 10 – Model of a GIS (in Italian language SIT = Sistema Informativo Territor...
Guidi A. 2015, Quantitative methods in Italian archaeology: a review, Archeologia e Calcolatori 26