Volumes / Journal / 19 - 2008 / Baxter M., Cool H.
Click on any image to open slideshow
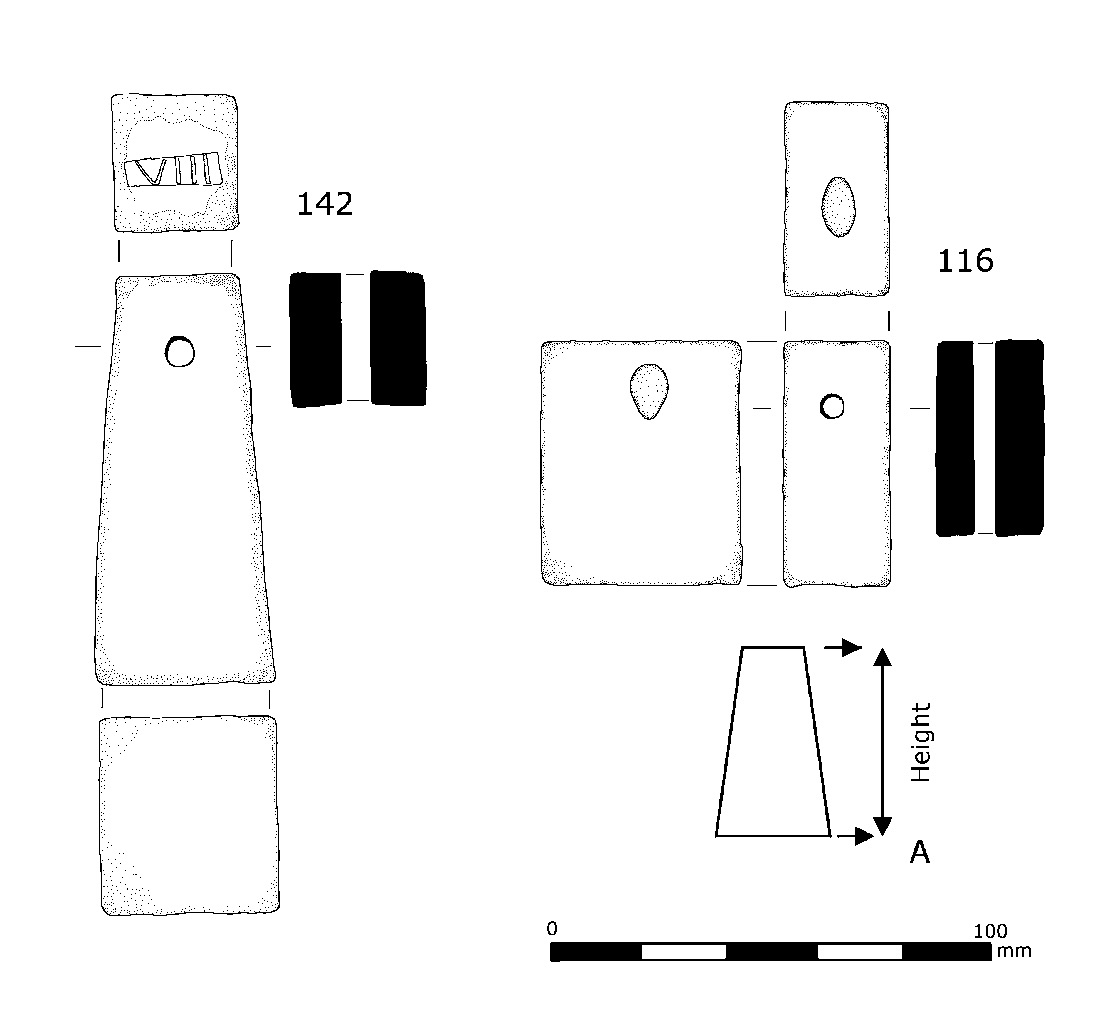
Fig. 1 – Examples of the ceramic loomweights discussed. Diagram A (not to scale)...
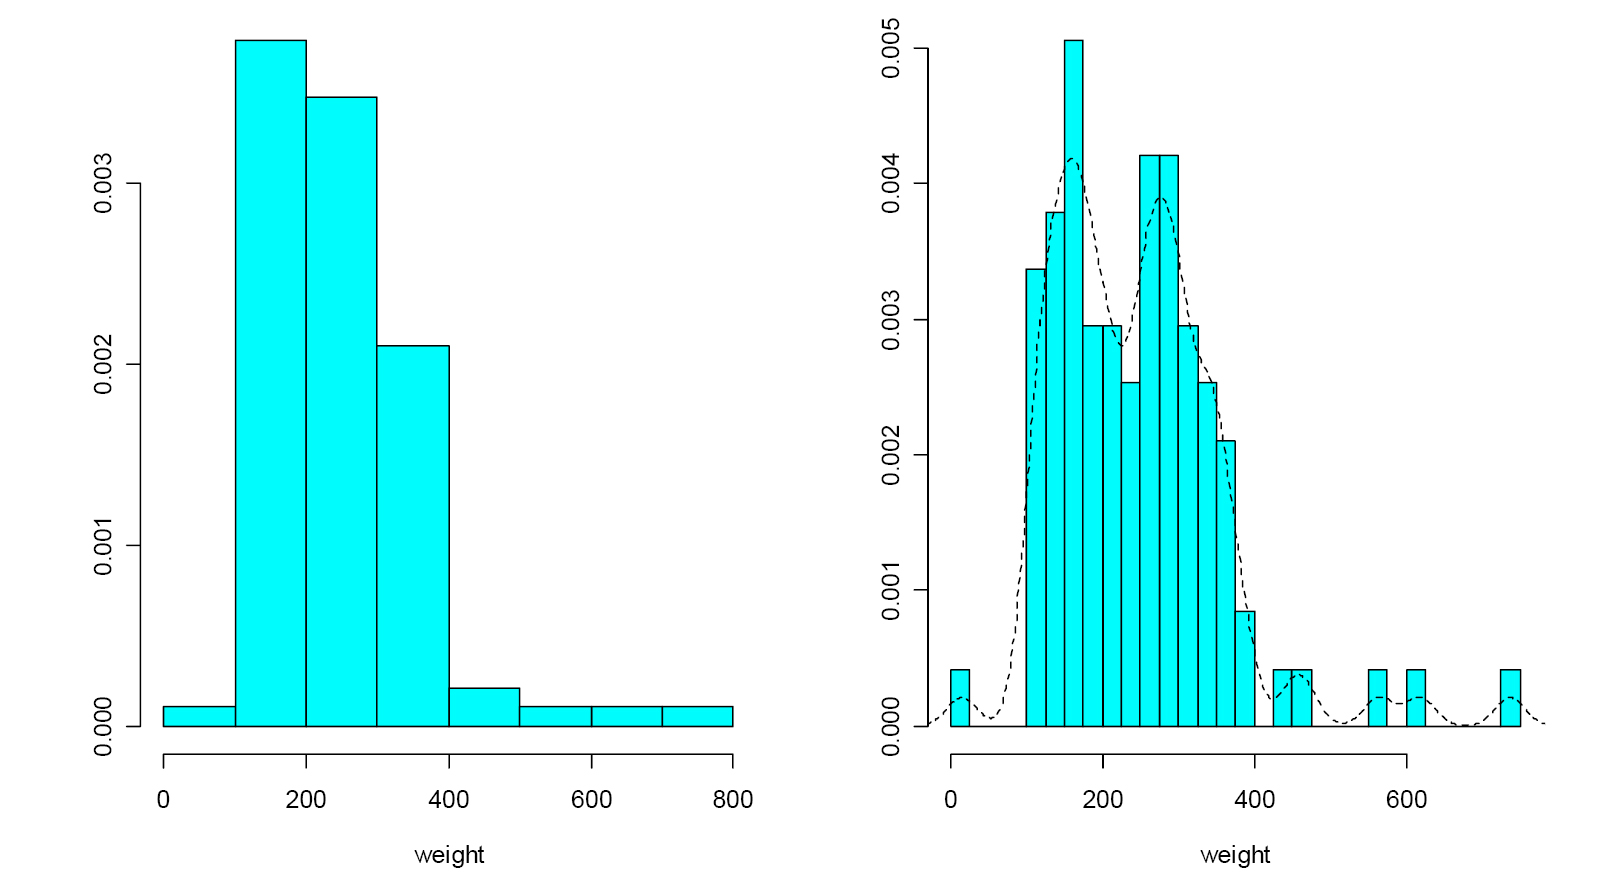
Fig. 2 – Two histograms using different bin-widths that show the distribution of...
Fig. 3 – An estimated two-component normal mixture for the weights of the loomwe...
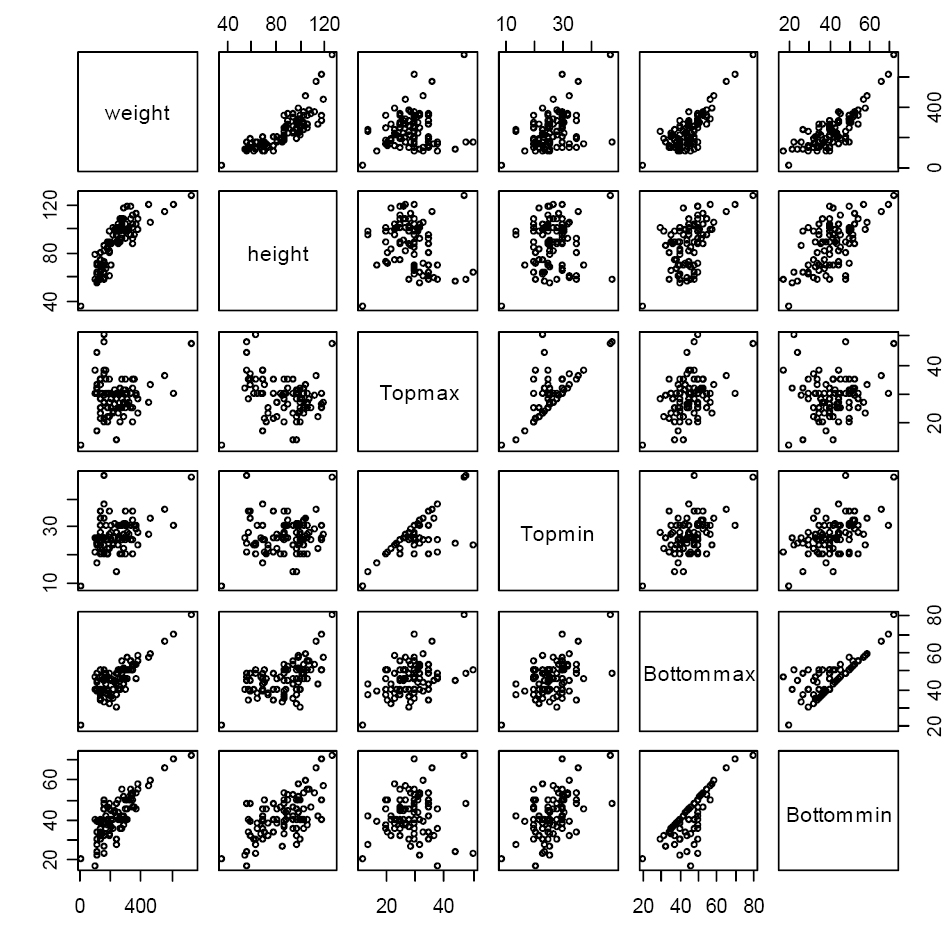
Fig. 4 – A “pairs” plot for six variables that characterise the loomweights, sho...
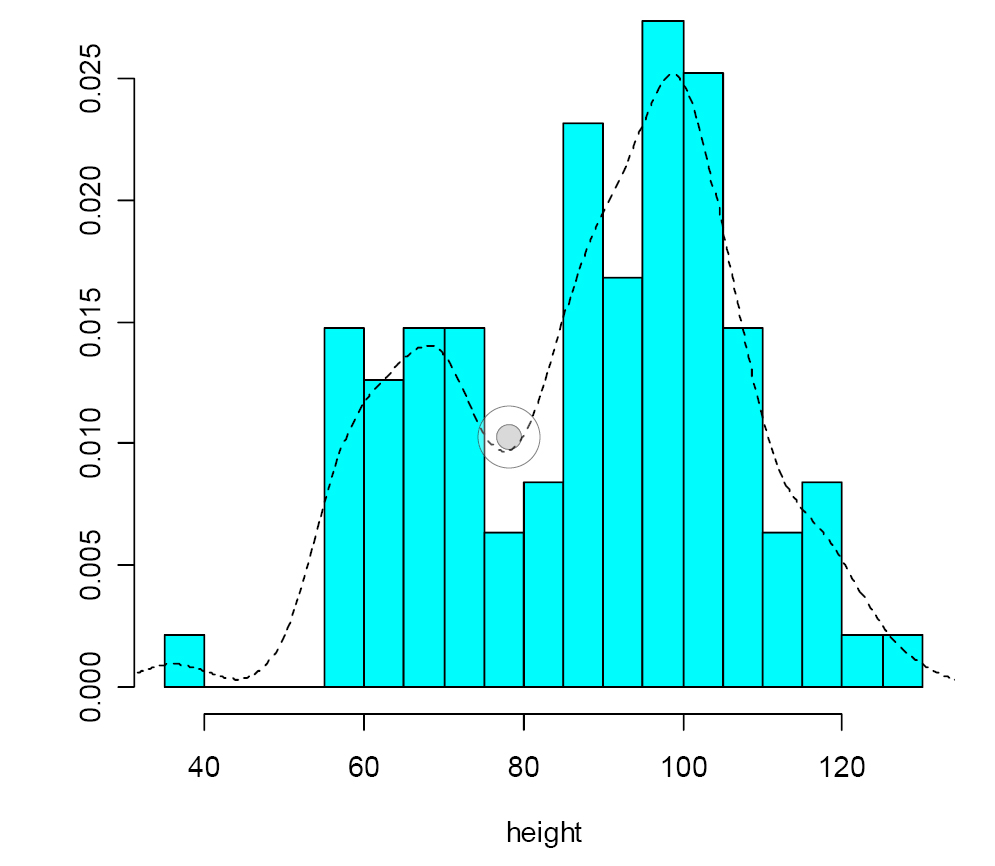
Fig. 5 – A histogram for the heights of the loom weights with a kernel density e...
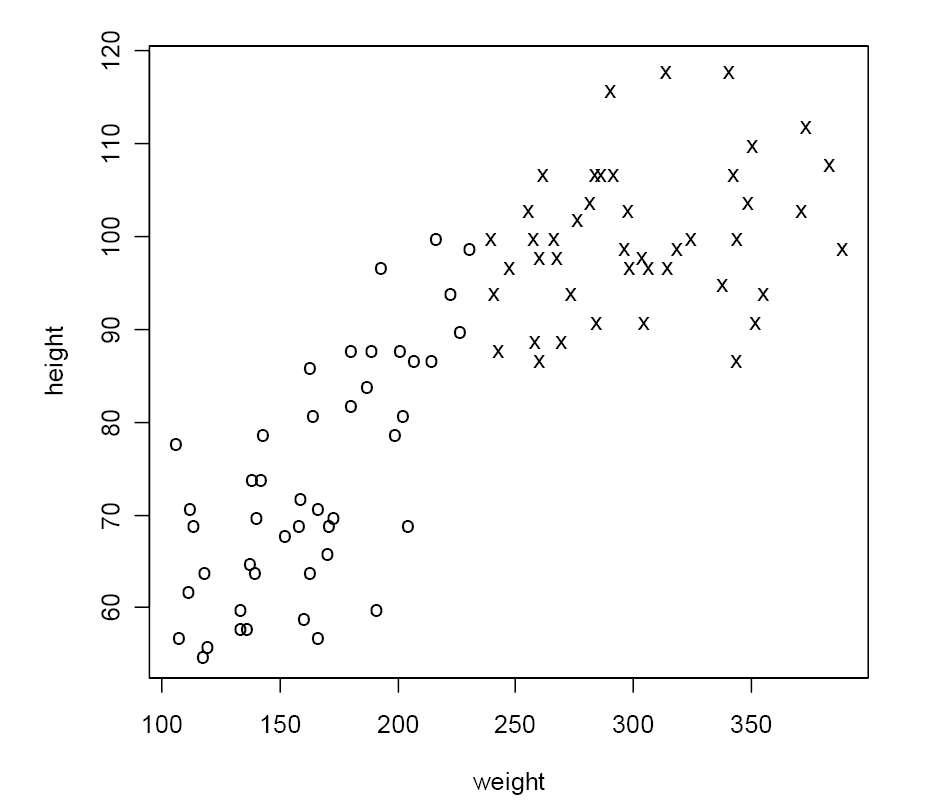
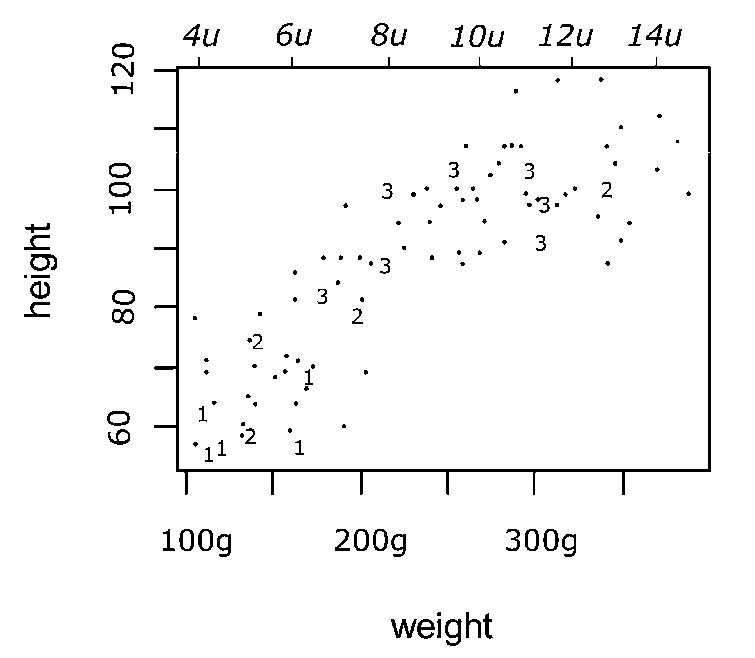
Fig. 6 – A plot of height against weight, with cases labelled by the classificat...
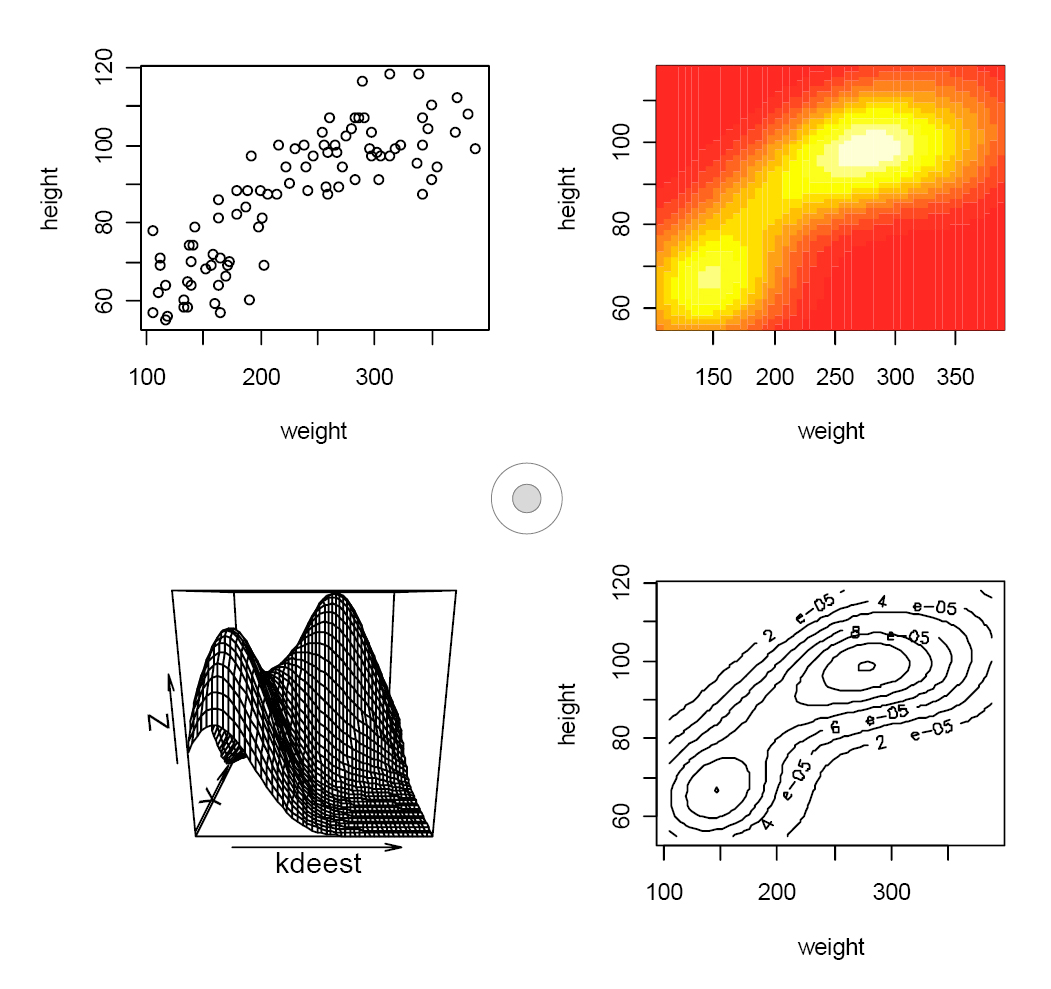
Fig. 7 – Different ways of displaying the relationship between height and weight...
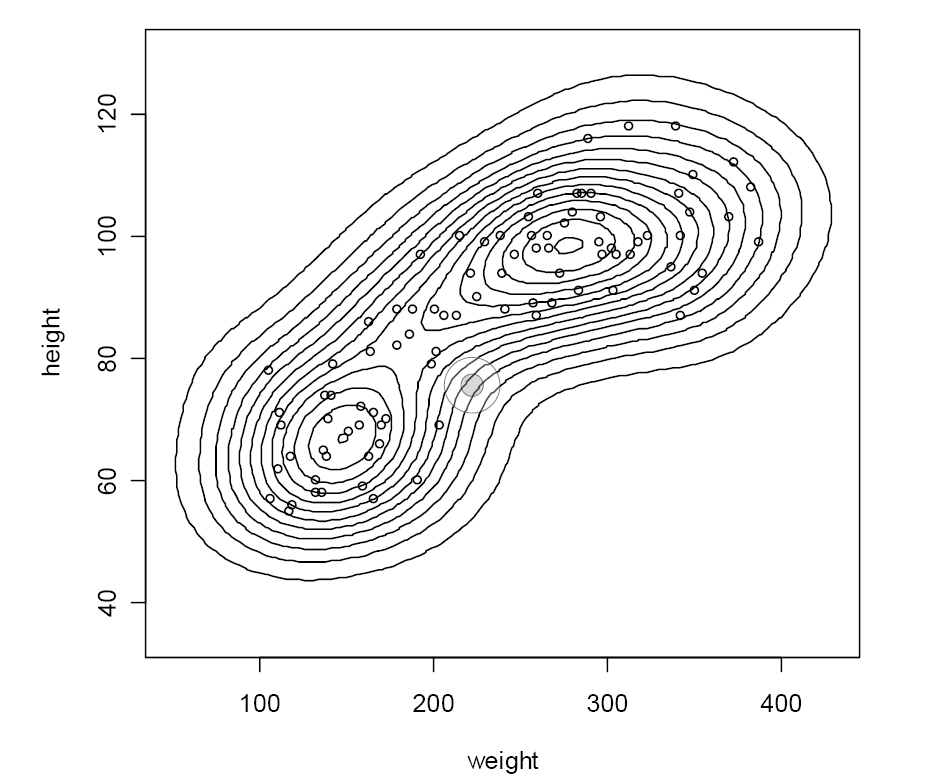
Fig. 8 – A customised version of the contour plot shown in Fig. 7.
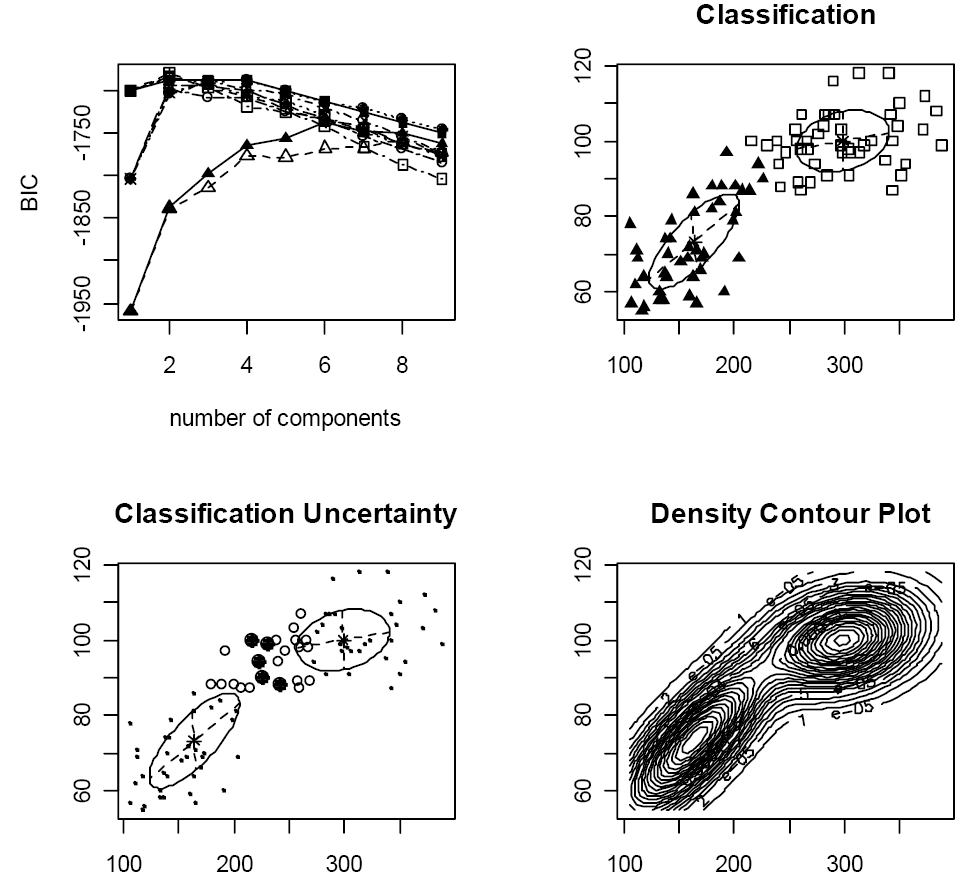
Fig. 9 – Assuming that the height/weight data can be modelled using a mixture of...
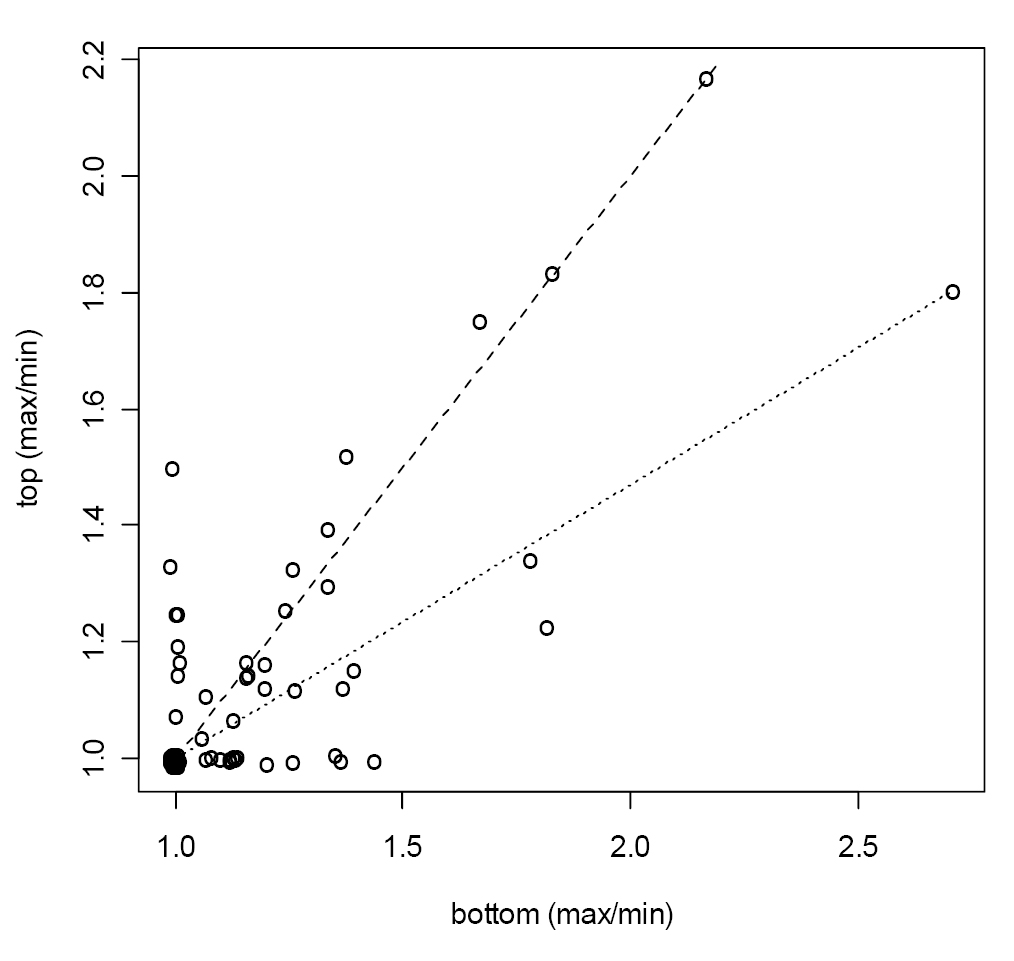
Fig. 10 – A plot of the maximum to minimum ratio of the tops of the loom weights...
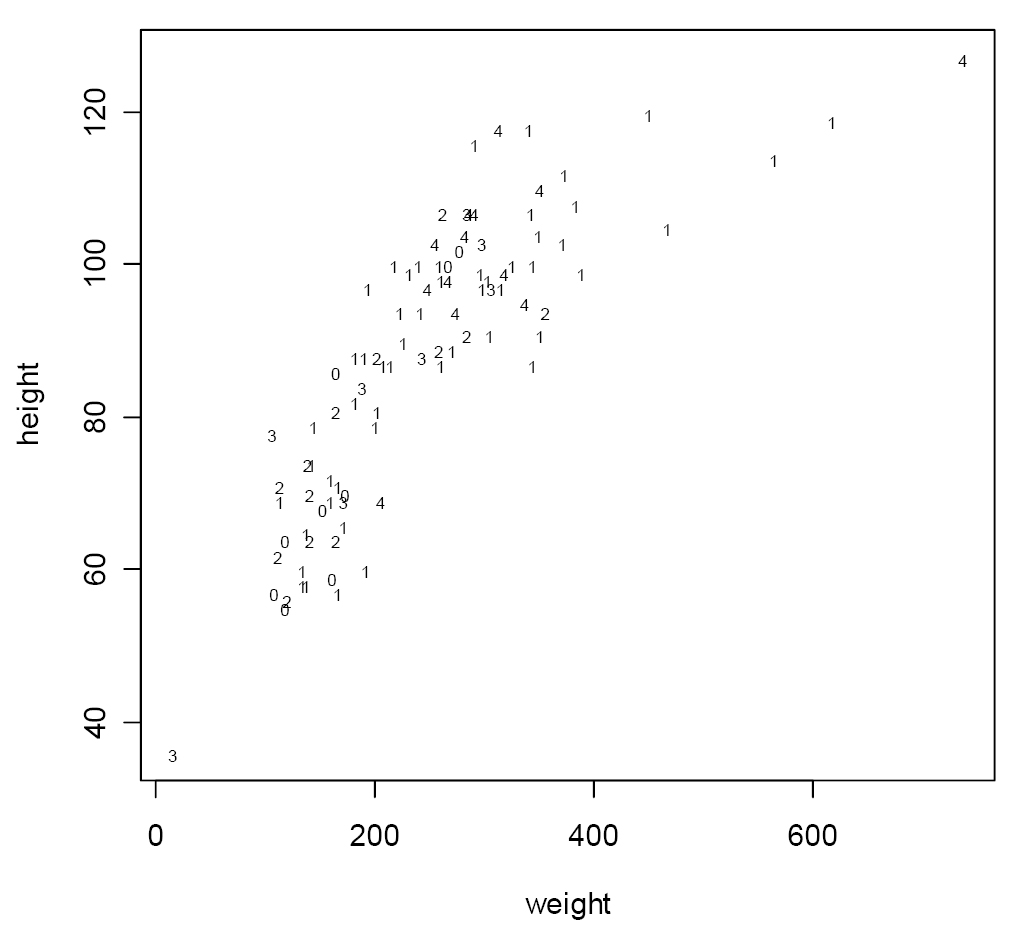
Fig. 11 – A plot of height against weight, labelled according to the shape typol...
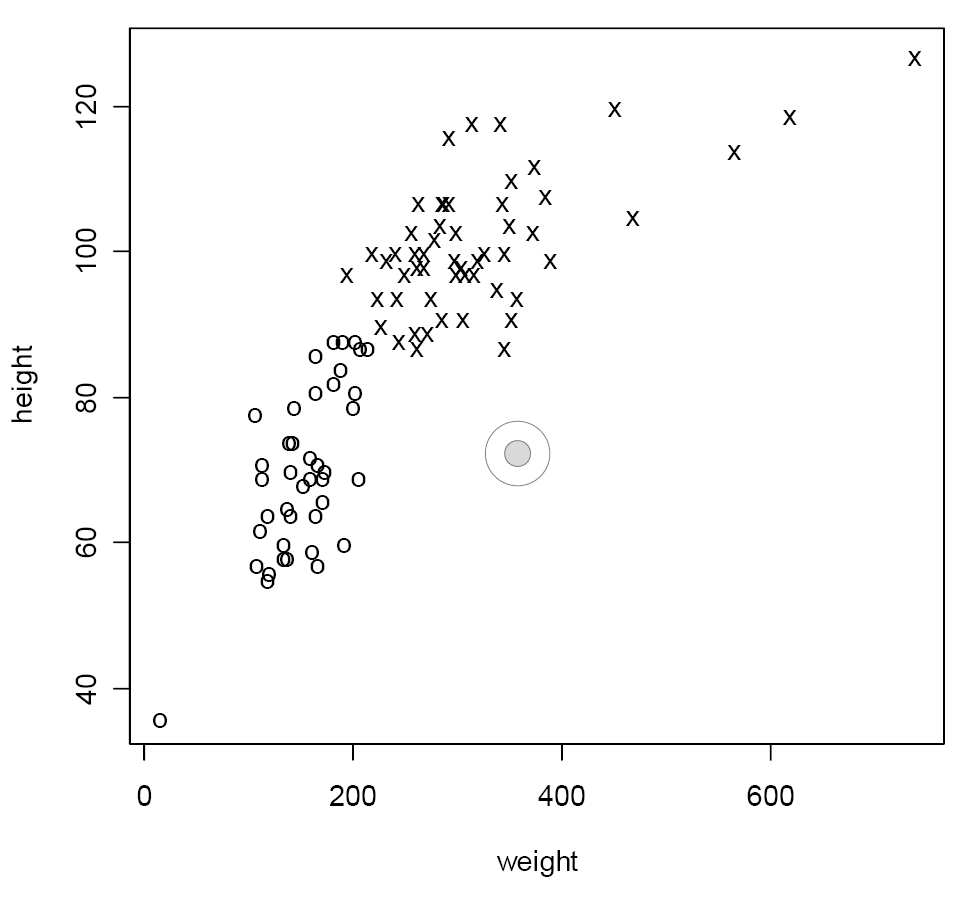
Fig. 12 – Similar to Fig. 6 but using all the data and with a modified size clas...
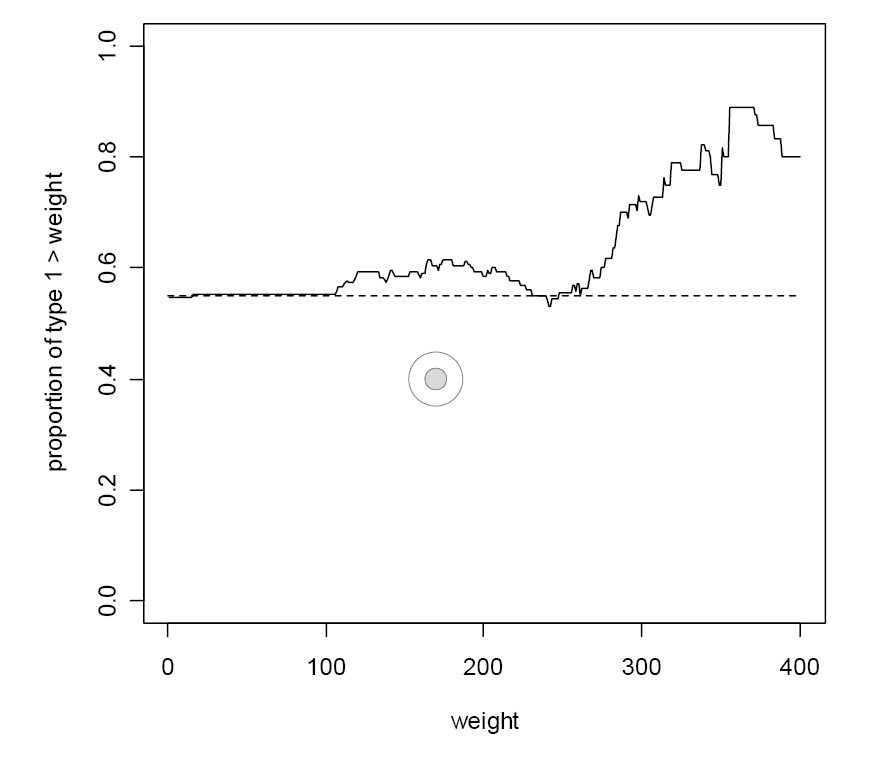
Fig. 13 – A graphic that suggests that Type 1 loomweights, with square tops and ...
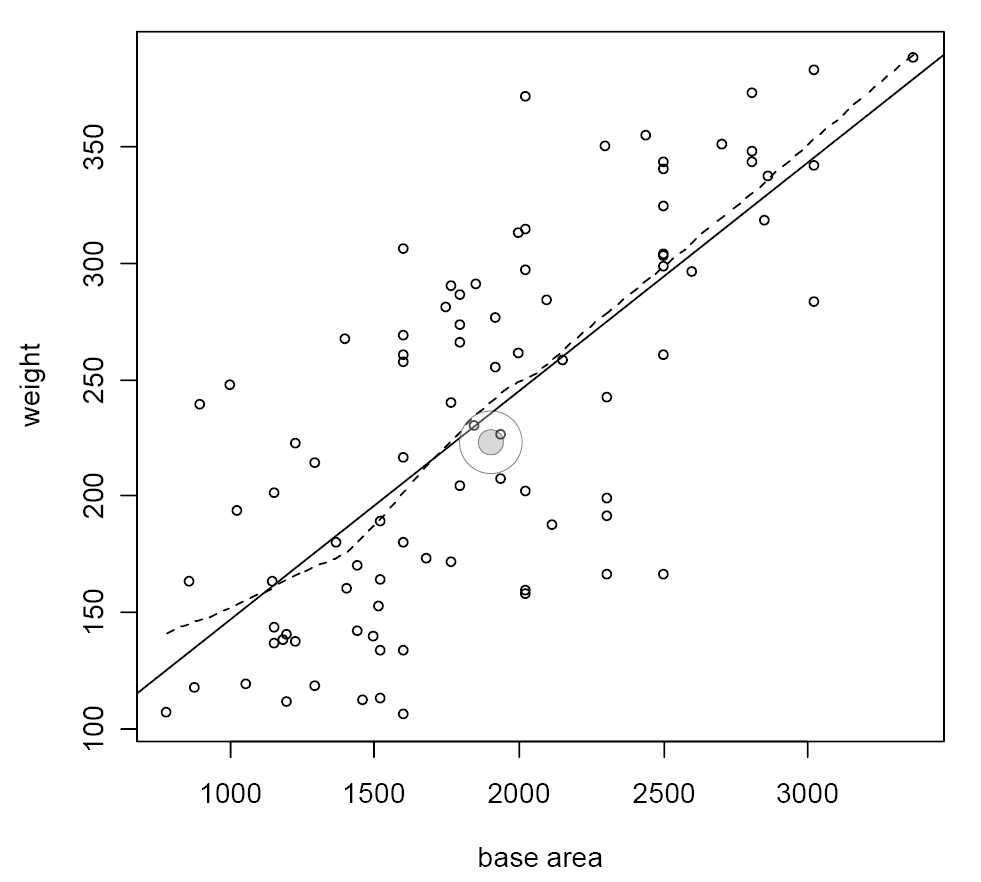
Fig. 14 – A plot of weight against base area, for the modified data that omits u...
Fig. 15 – A plot of the modified dataset labelled with the Casa del Chirugo grou...
Baxter M., Cool H. 2008, Notes on the statistical analysis of some loomweights from Pompeii, Archeologia e Calcolatori 19