Volumes / Journal / 18 - 2007 / Niknami K.
Click on any image to open slideshow
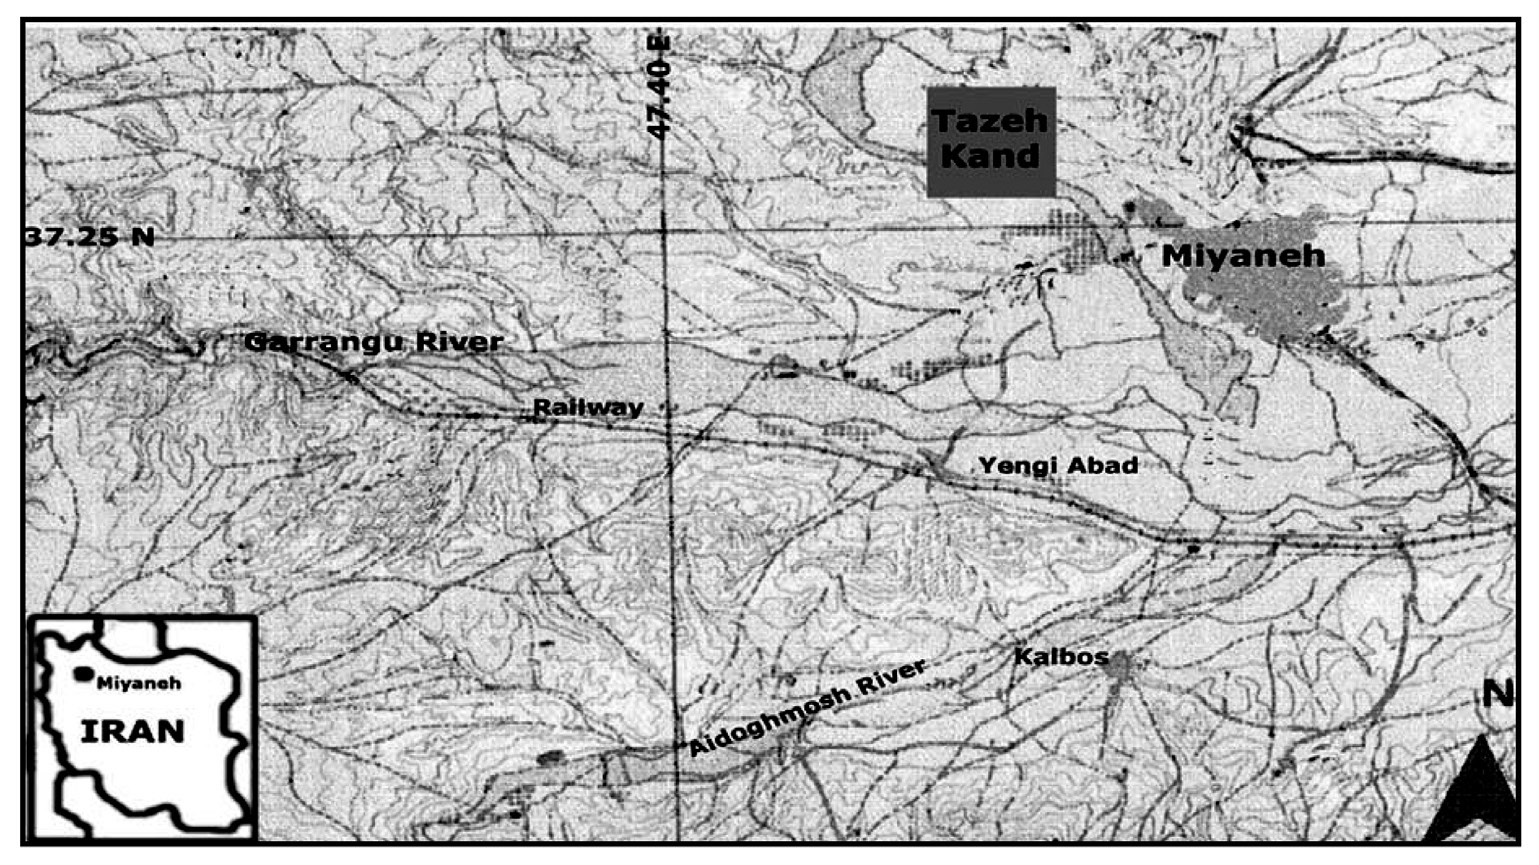
Fig. 1 – Map of study area in Northern Iran, location of survey project and samp...
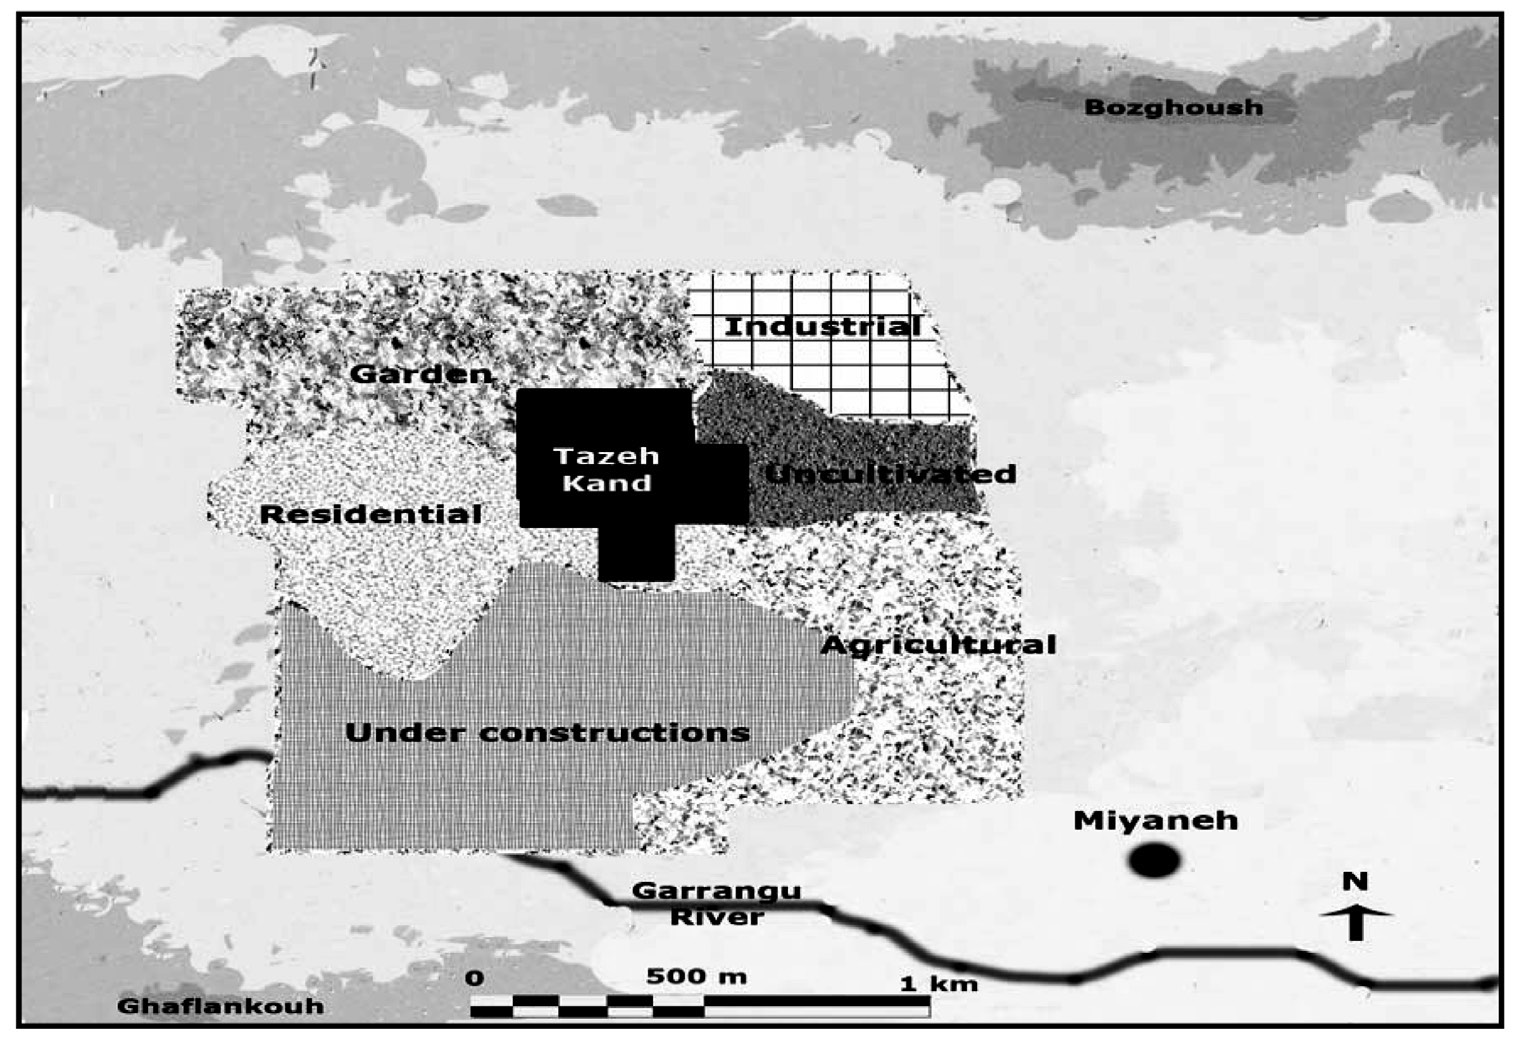
Fig. 2 – Graphical representation of sampled modern land use types in the study ...
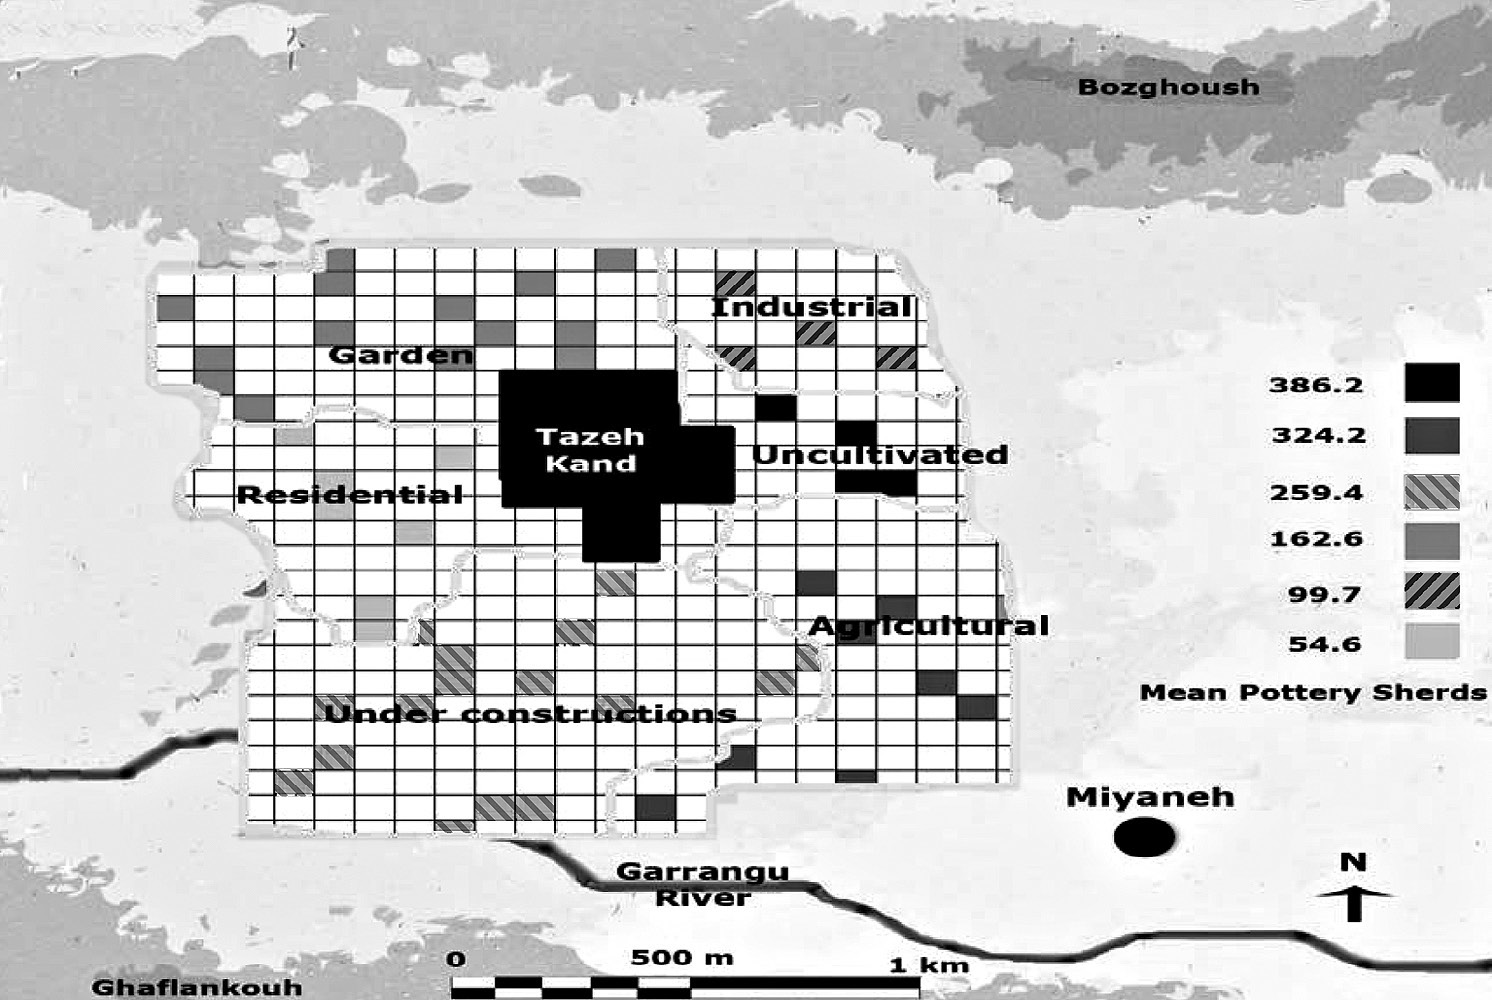
Fig. 3 – Frequency of mean pottery sherds sampled from each land use type.
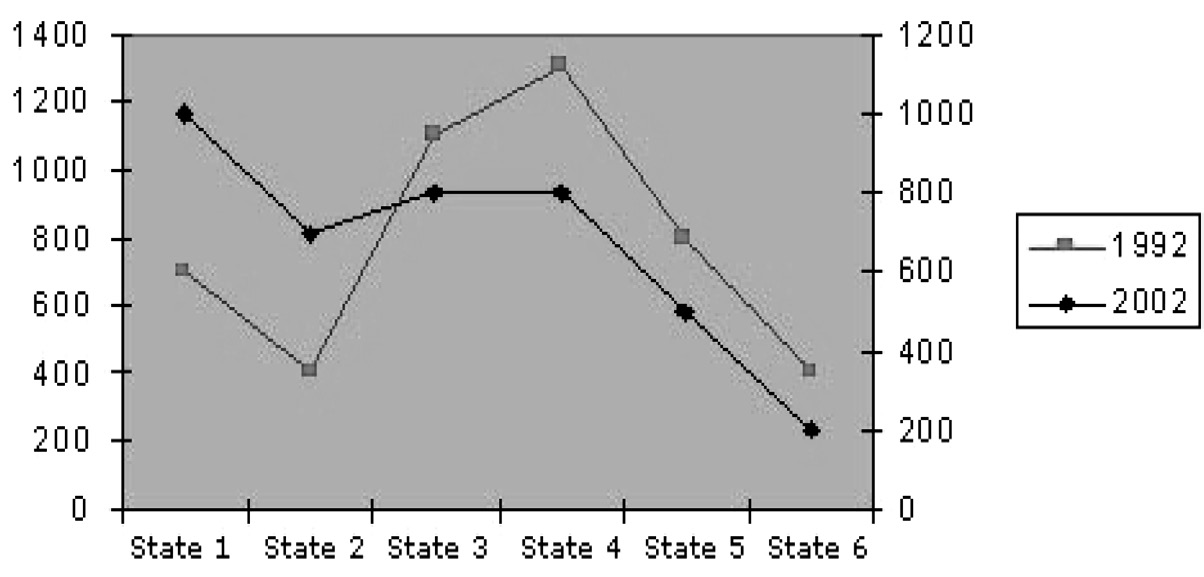
Fig. 4 – Frequency of land use types between 1992 and 2002.
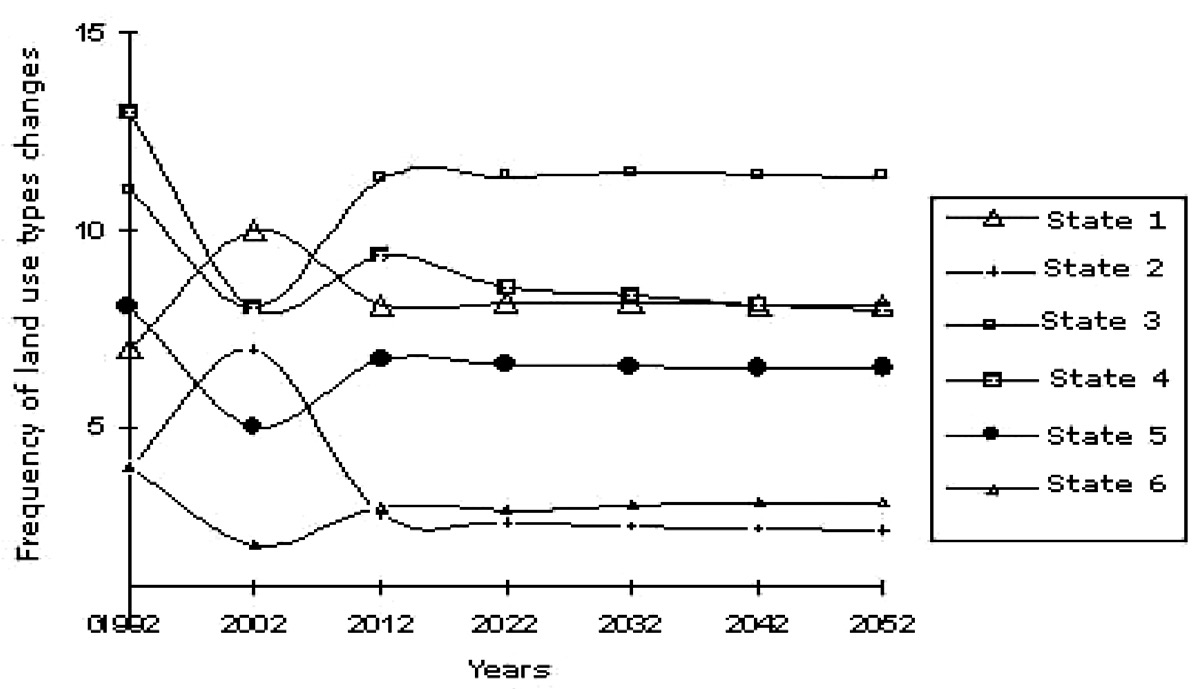
Fig. 5 – Expected values of land use changes during 50 years.
Niknami K. 2007, A stochastic model to simulate and predict archaeological landscape taphonomy: monitoring cultural landscape values based on an Iranian survey project, Archeologia e Calcolatori 18