IADI Image
Metadata
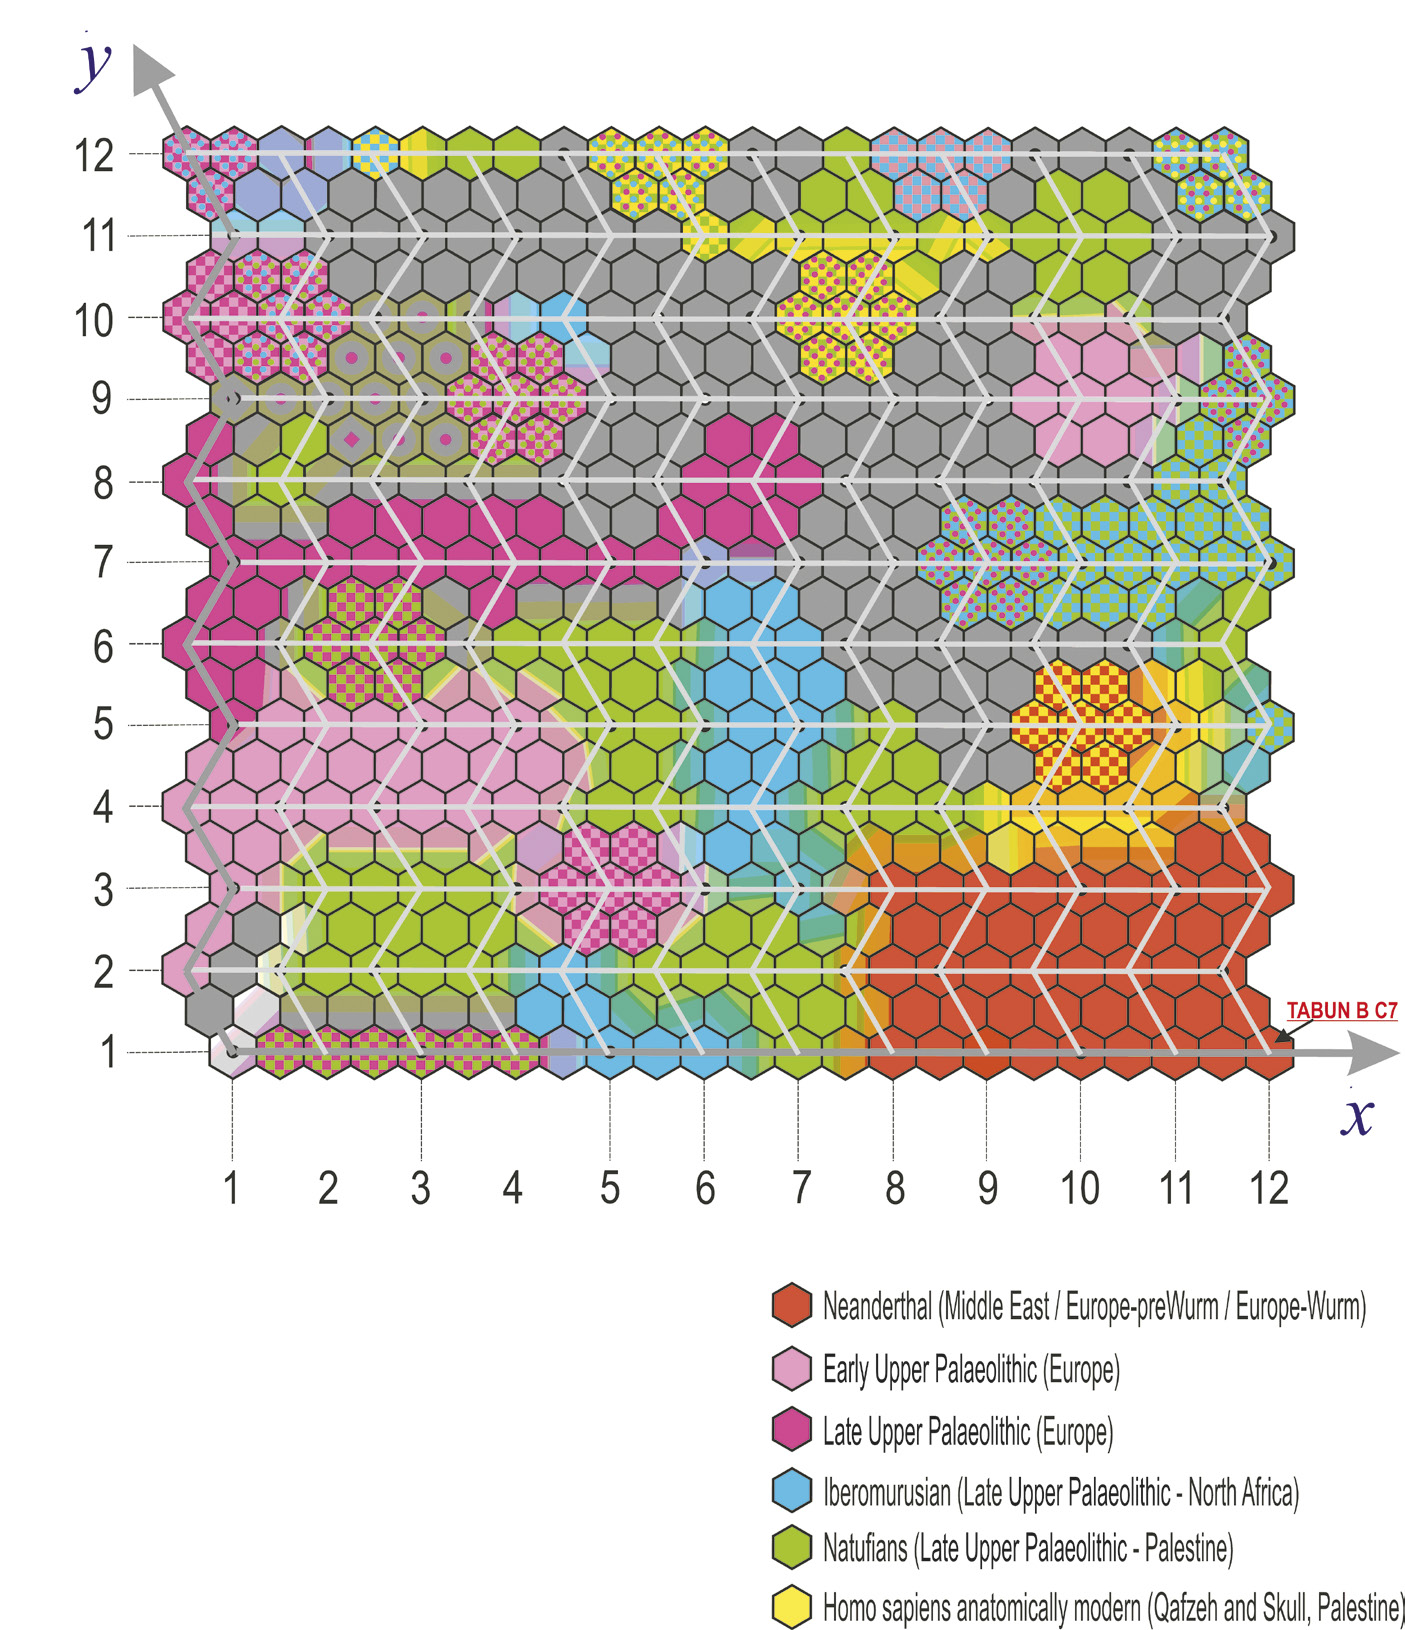
| Caption | Example of a Self-Organizing Map (Kohonen 1982) concerning the analysis of 126 dentitions from different geographic locations and periods. The map is a 12×12 lattice corresponding to 144 neurons. Several samples can be mapped to a same neuron (not shown). We display only the position of the sample Tabun BC7 that falls in an area whose neurons became specialized in the description of the Neanderthal teeth morphotype. The map has been colored according to time periods and geographical areas. Gray cells correspond to empty neurons, meaning that no inputs were linked to them in the classification process (redrawn from Coppa et al. 2007a). |
| Figure number | 3 |
| Article | Kohonen self-organizing Maps to unravel patterns of dental morphology in space and time |
| Authors | Manni F., Coppa A., Candilio F. |
| Volume | Volume 6 |