IADI Image
Metadata
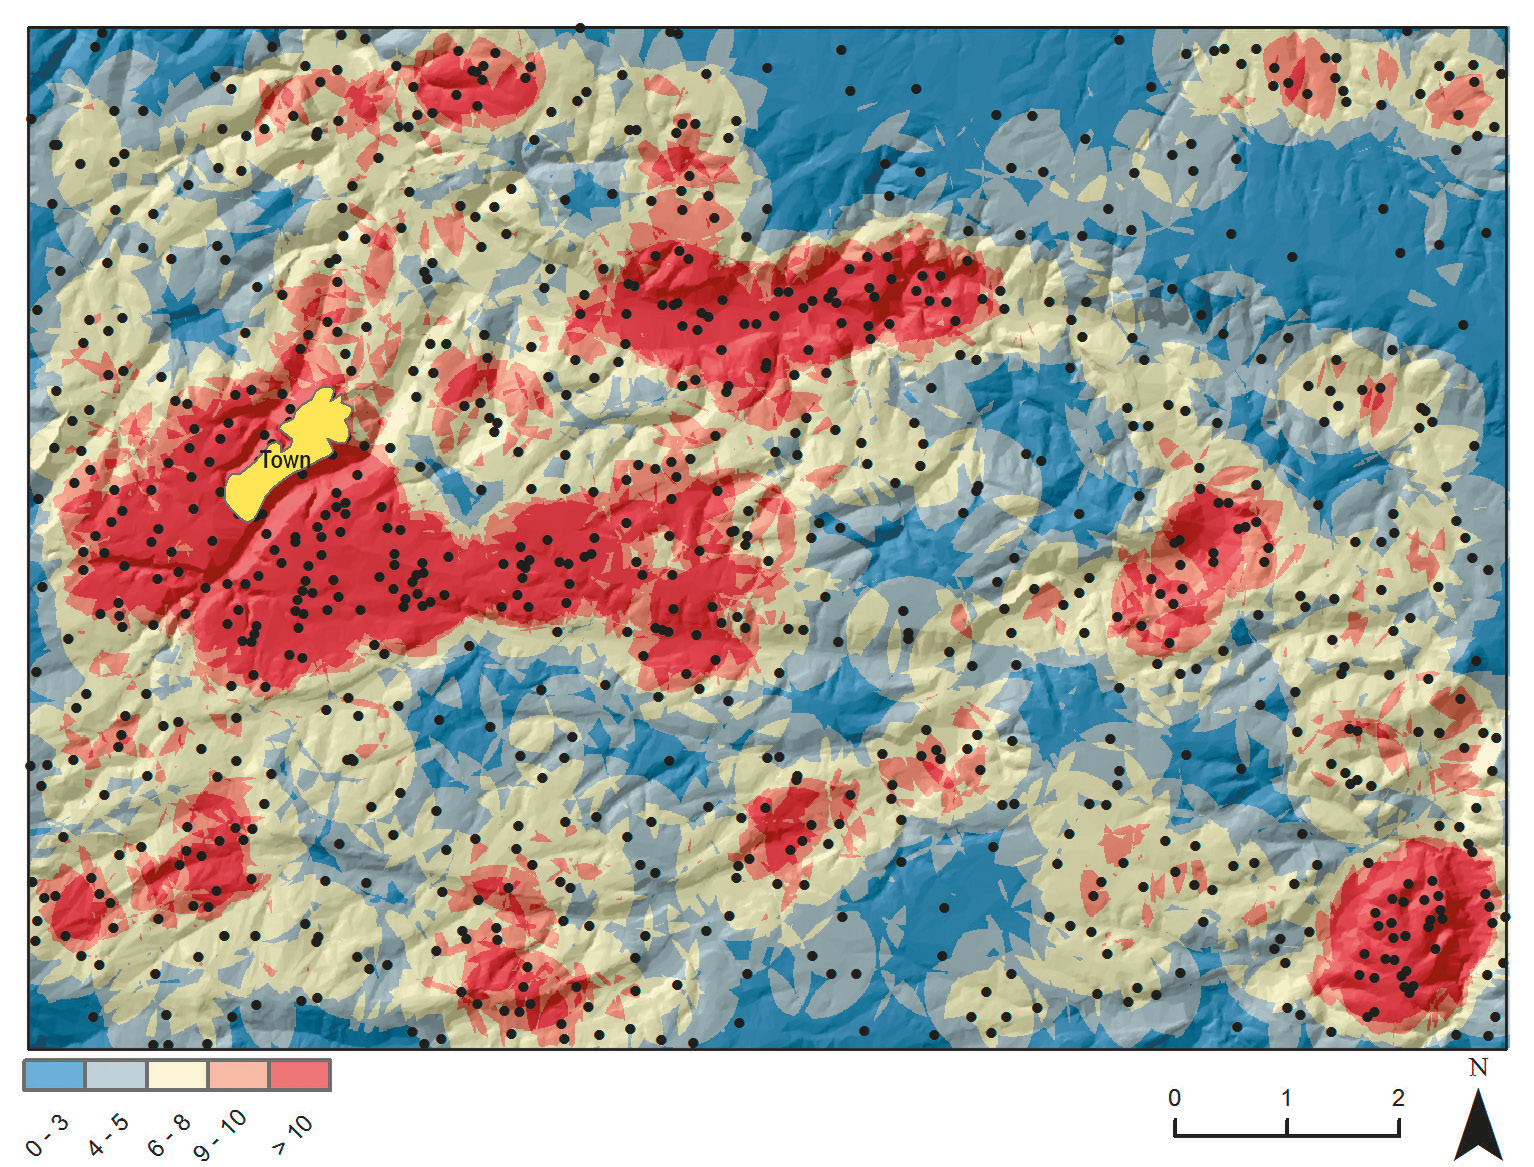
| Caption | Point-density analysis of the “complete” early colonial distribution (262 recorded sites plus 600 missing sites, therefore 862 sites in total). The legend indicates the number of sites located in a circle of one square km from each cell (resolution 10×10 m). The raster base map is the shaded relief calculated from the 10 m-resolution DEM named TINITALY/01 (Tarquini et al. 2007, 2012; Tarquini, Nannipieri 2017). Figure by the author. |
| Figure number | 5 |
| Article | A method for modeling dispersed settlements: visualizing an early Roman colonial landscape as expected by conventional theory |
| Authors | Casarotto A. |
| Volume | Volume 28(1) |