IADI Image
Metadata
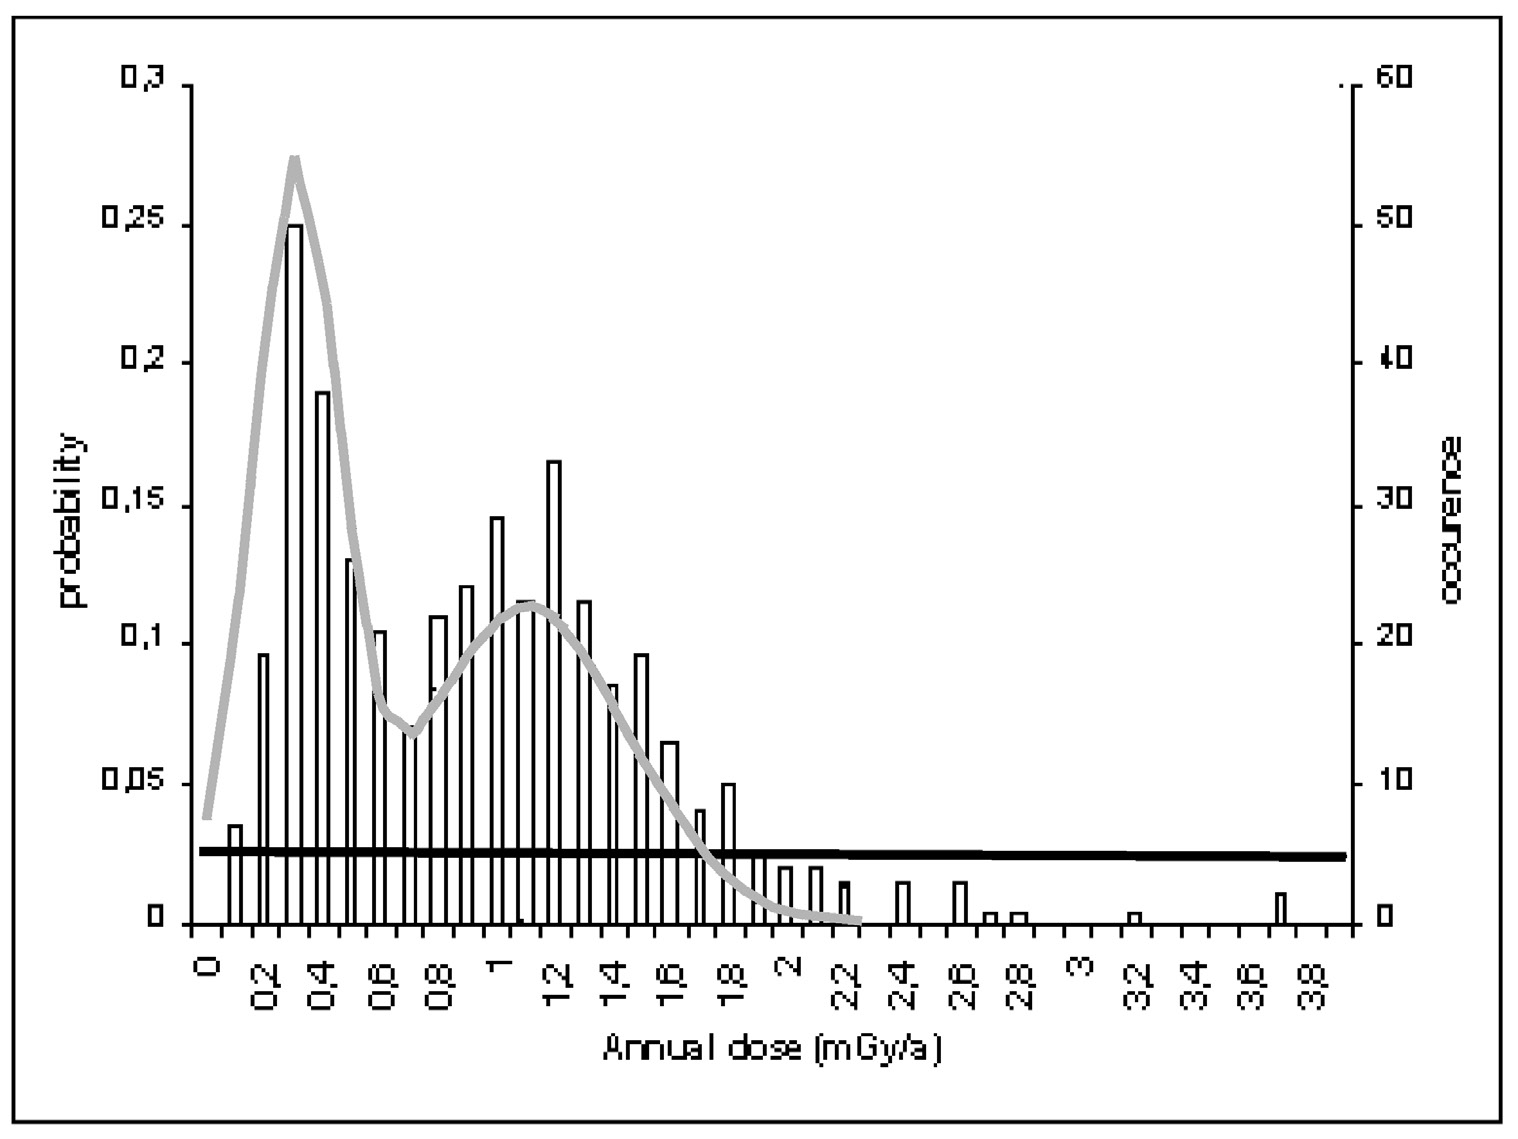
| Caption | Model of gamma external dose. The histogram is based on a compilation of the occurrences collected on a database of 50 references. The grey line shows a uniform distribution of probability between 0 and 4 mGy/a based on the minimum and maximum values of the database. The black line shows a distribution of probability simulated the histogram and based on two gaussians with the respective mean and standard deviation: 0.30 ± 0.15 and 1.10 ± 0.35. |
| Figure number | 1 |
| Article | Bayesian approach applied to authenticity testing by luminescence |
| Authors | Zink A. |
| Volume | Volume 13 |