IADI Image
Metadata
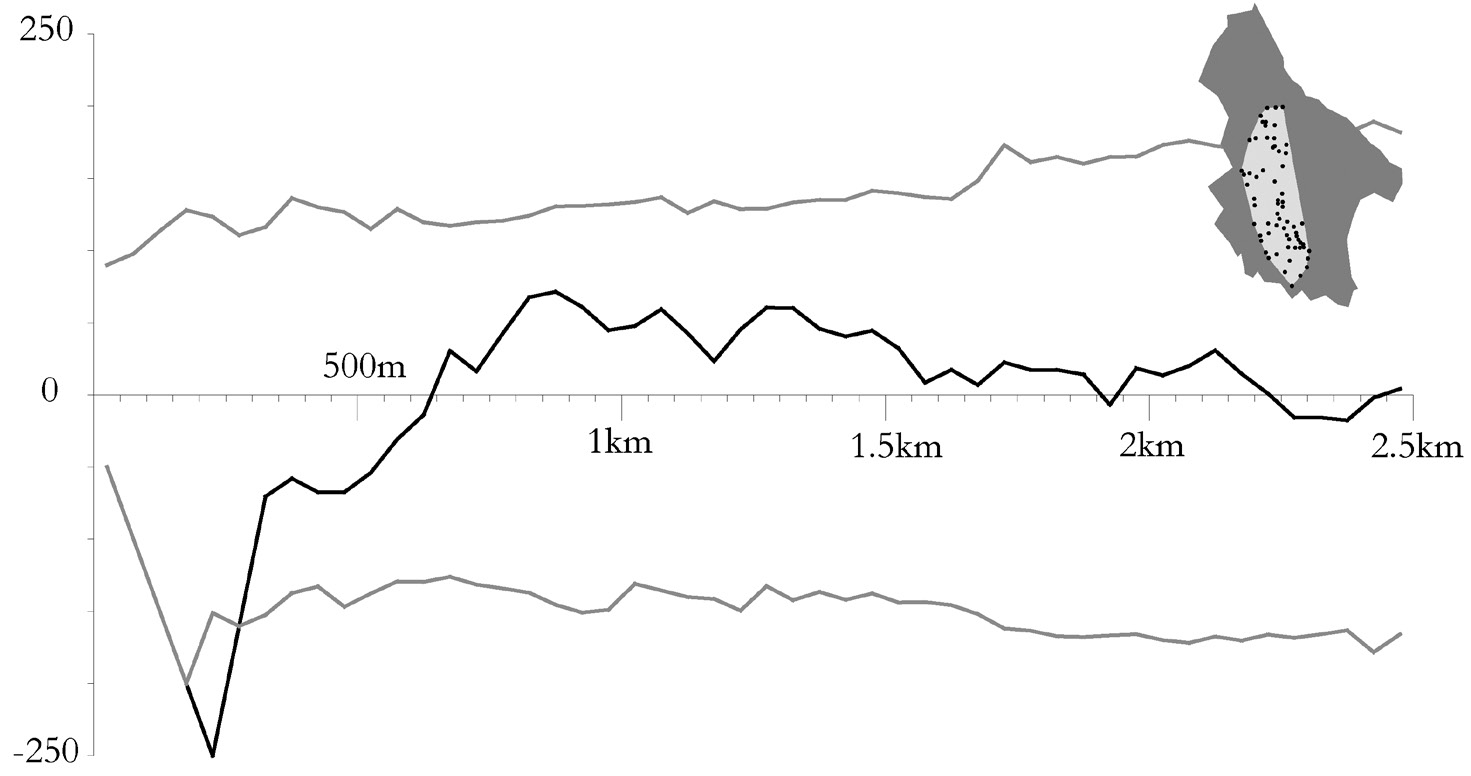
| Caption | Ripley’s K as a modified function (L). The black line shows the observed density values for Kytheran villages and the grey lines represent a p=0.01 probability envelope. The x-axis bars are at 50m intervals. |
| Figure number | 13 |
| Article | A digital Mediterranean countryside: GIS approaches to the spatial structure of the post-medieval landscape on Kythera (Greece) |
| Authors | Bevan A., Frederick C., Krahtopoulou A. |
| Volume | Volume 14 |