IADI Image
Metadata
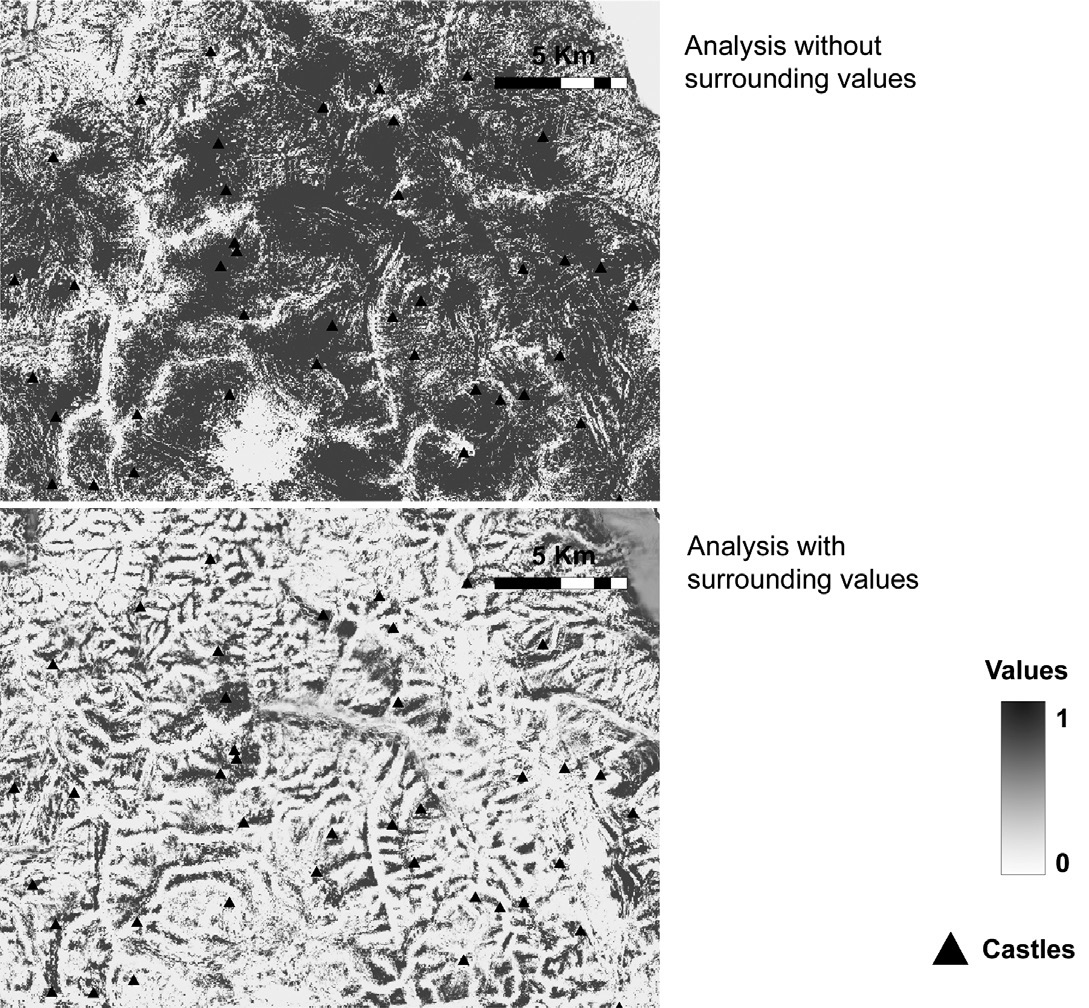
| Caption | Comparison of analyses results using a line chart. Each line represents the sequence of ordered values for each castle taken from three different output raster surfaces (examples 1,2and3).By some aspects this chart may be used as a significance measurement for different networks. |
| Figure number | 5 |
| Article | Artificial Neural Networks in archaeology |
| Authors | Deravignone L., Macchi Jánica G. |
| Volume | Volume 17 |